Image caption
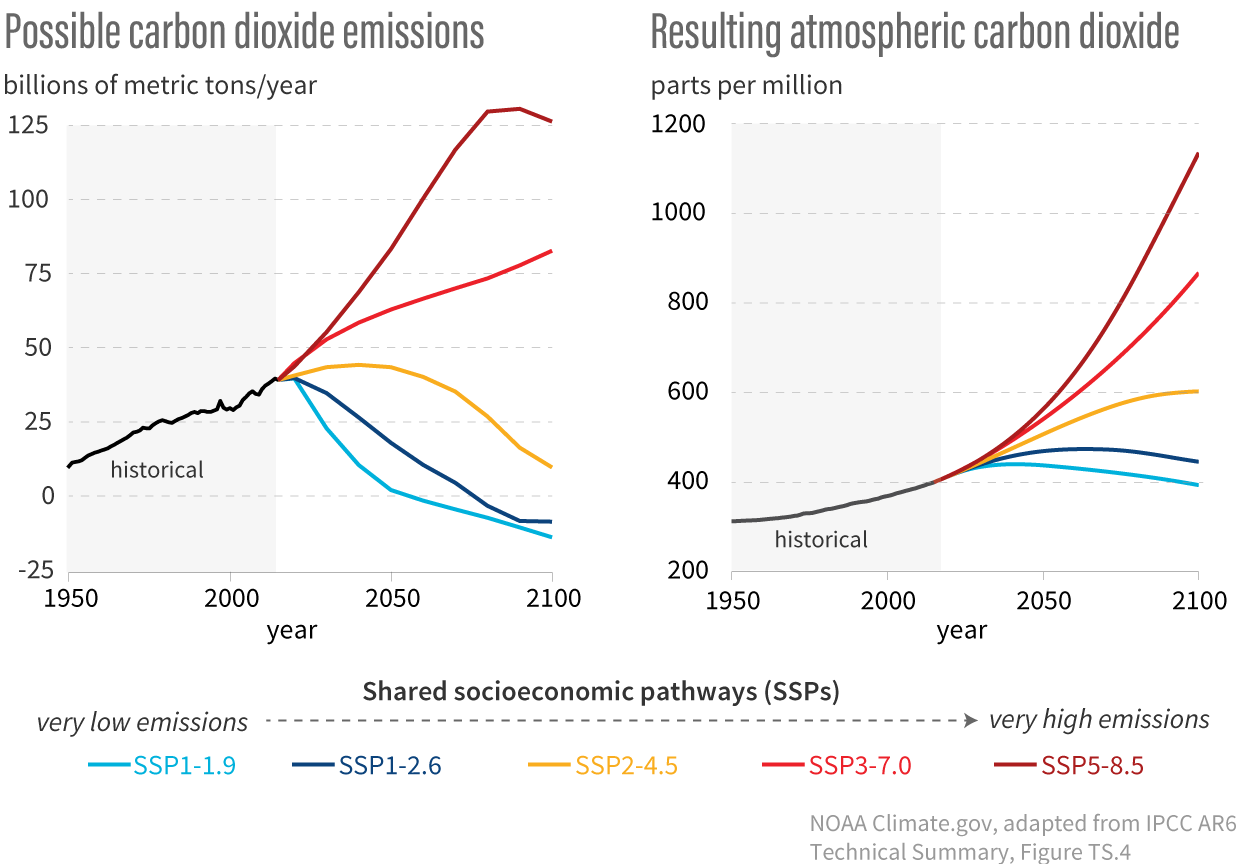
Possible future pathways for yearly global carbon dioxide emissions (left) and the resulting atmospheric carbon dioxide concentrations (right) through the end of the century. These possible futures are based on different shared socioeconomic pathways ("SSPs" for short). Each pathway is an internally consistent set of assumptions about future population growth, global and regional economic activity, and technological advances. Climate models use the pathways to project a range of possible future atmospheric carbon dioxide amounts; for simplicity, the image shows the only the mean value predicted by the models for each pathway, not the full range of uncertainty. NOAA Climate.gov graphic adapted from figure TS.4 in the IPCC Sixth Assessment Report Technical Summary.