
Image caption
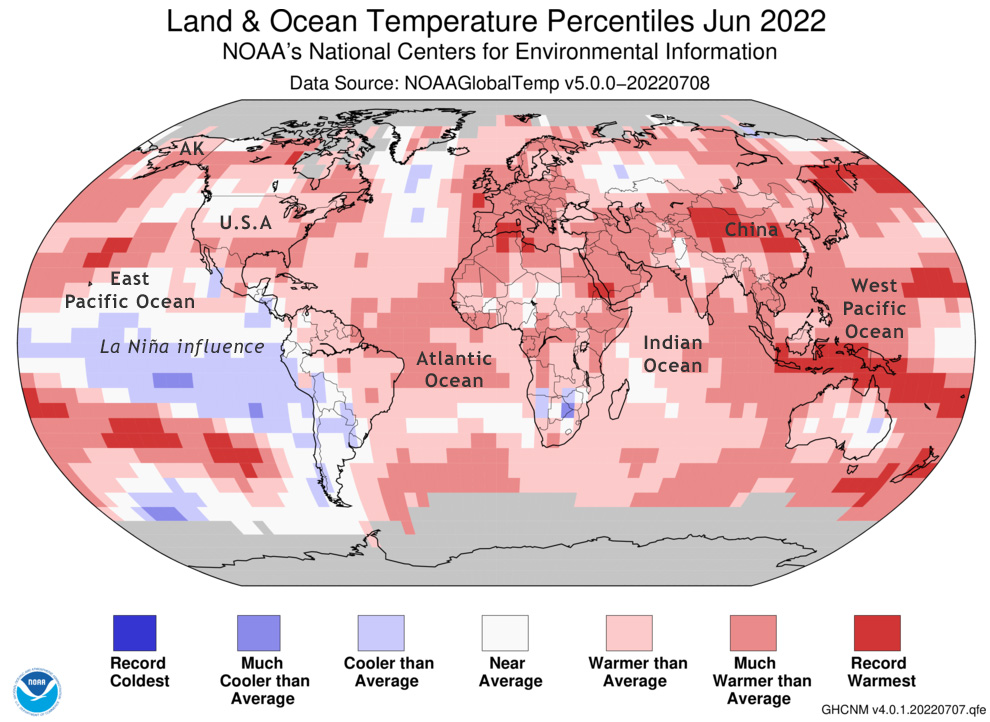
Global map of temperatures in June 2022 compared to the historical record, with places that were warmer than average in red and places that were cooler than average in blue. NOAA National Centers for Environmental Information.
Global map of temperatures in June 2022 compared to the historical record, with places that were warmer than average in red and places that were cooler than average in blue. NOAA National Centers for Environmental Information.