
Image caption
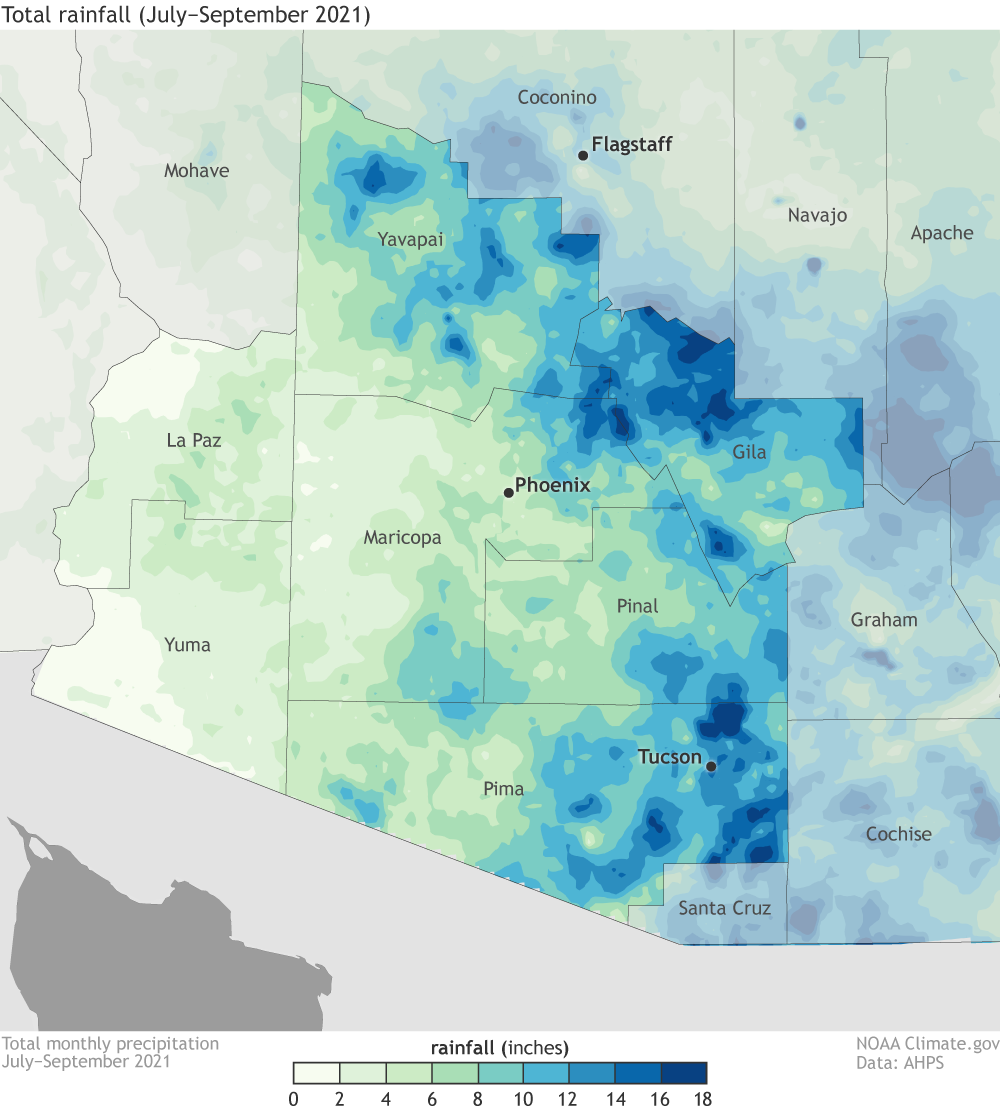
Total precipitation for the 2021 wet monsoon season in Arizona (July-September). Parts of several counties received 18 inches or more (darkest blue) of rainfall. NOAA Climate.gov map, based on PRISM data from Oregon State University.
Total precipitation for the 2021 wet monsoon season in Arizona (July-September). Parts of several counties received 18 inches or more (darkest blue) of rainfall. NOAA Climate.gov map, based on PRISM data from Oregon State University.