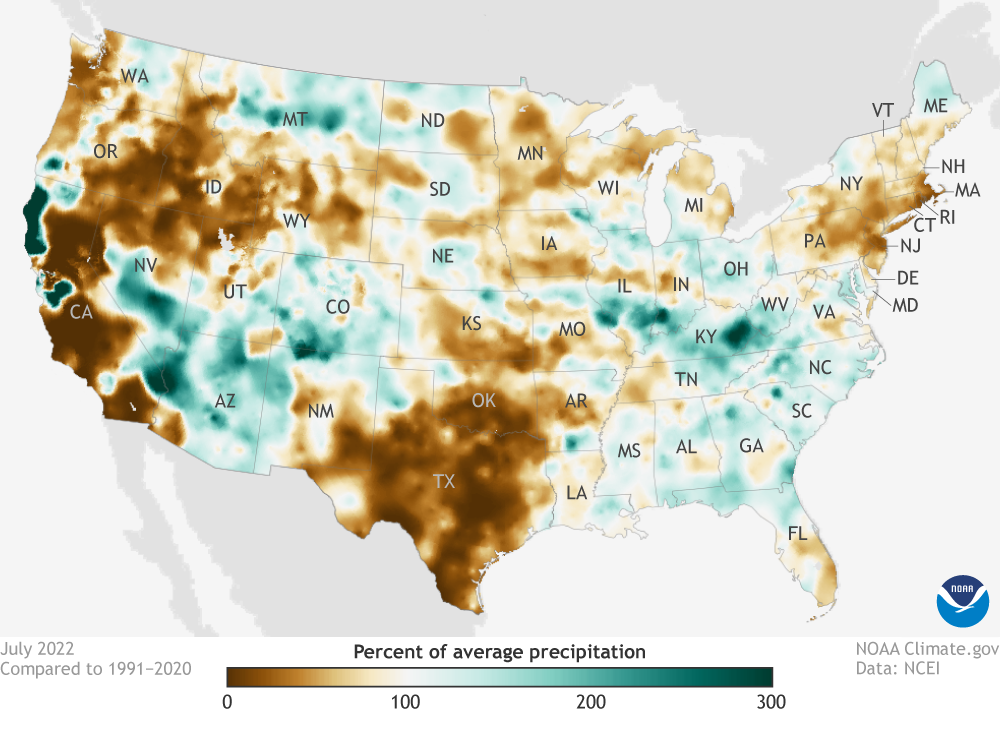
Image caption
July 2022 precipitation as a percent of the 1991-2020 average for the contiguous United States. Places that were wetter than average are green, while places that were drier than average for July are brown. NOAA Climate.gov map, based on data from NOAA National Centers for Environmental Information.