
Image caption
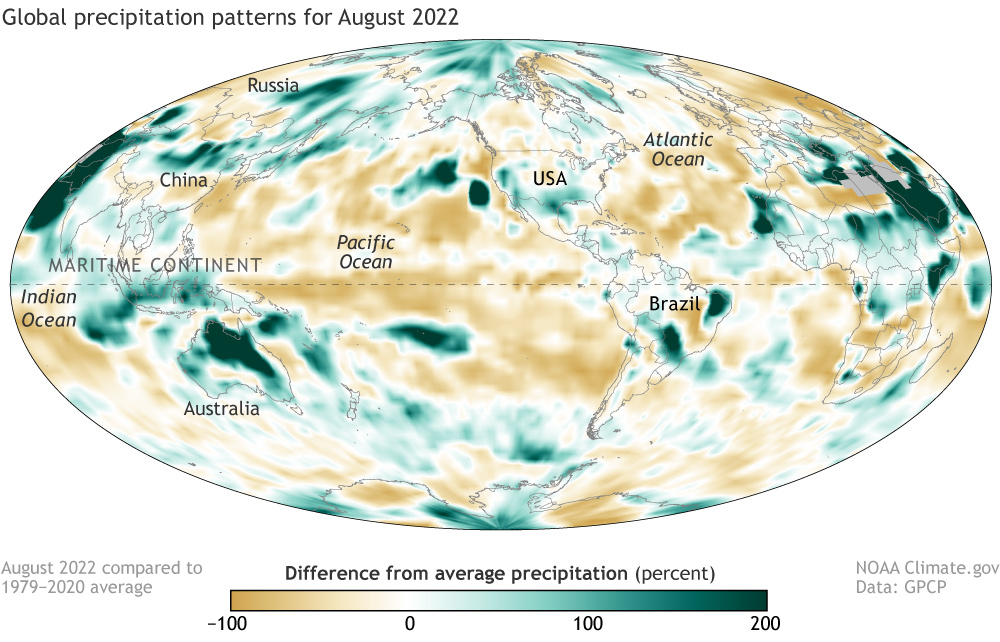
Precipitation in August 2022 shown as percent difference from the 1979–2020 average. Places where precipitation was below average are brown, while places where precipitation was above average are green. NOAA Climate.gov map, based on data from the Global Precipitation Climatology Project.