
Image caption
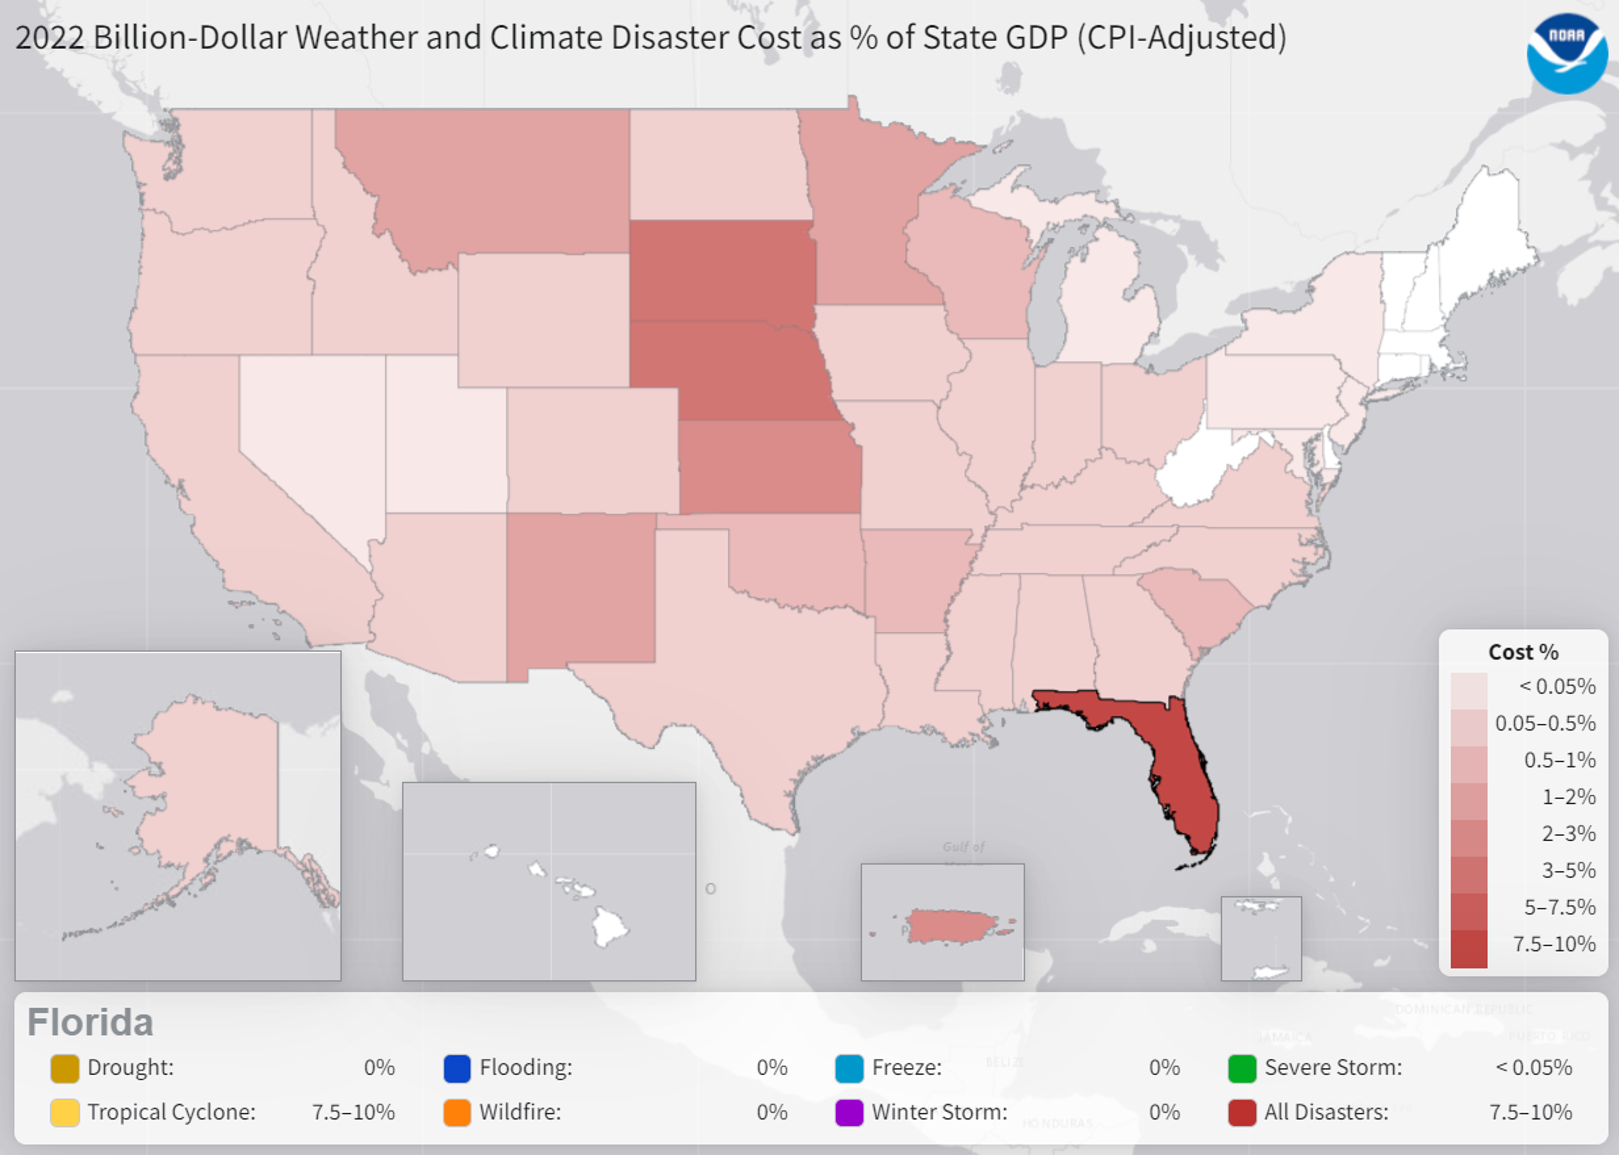
Screenshot of a map the US showing billion-dollar disasters costs for each state during 2022 as a percentage of each state's 2022 gross domestic product (GDP). NOAA NCEI image from the Billion-dollar Disaster web mapping tool.
Screenshot of a map the US showing billion-dollar disasters costs for each state during 2022 as a percentage of each state's 2022 gross domestic product (GDP). NOAA NCEI image from the Billion-dollar Disaster web mapping tool.