
Image caption
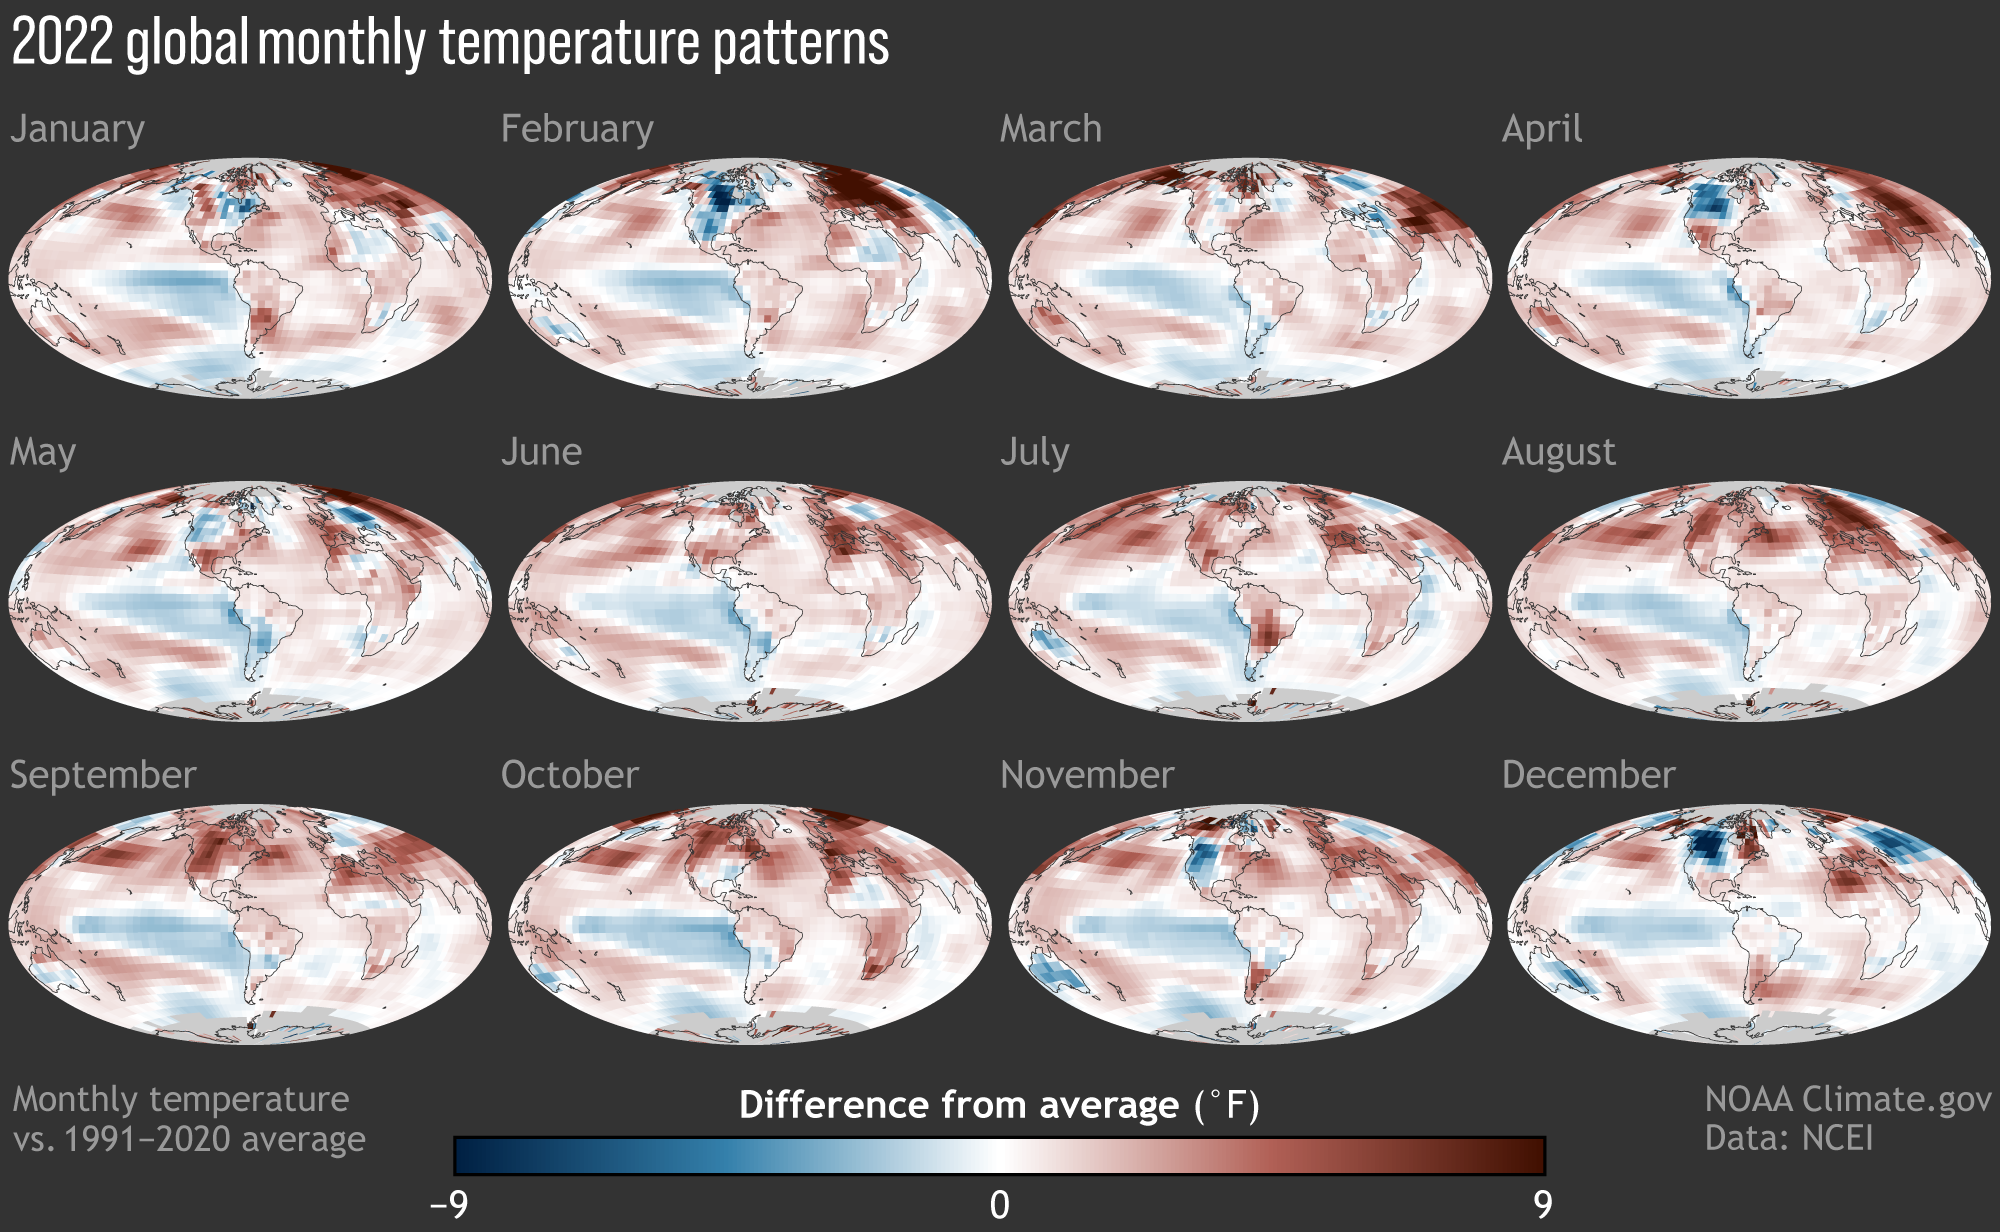
Monthly temperatures in 2022 from January (upper left) through December (bottom right) compared to the 1991-2020 average. Image by NOAA Climate.gov, based on NCEI data.
Monthly temperatures in 2022 from January (upper left) through December (bottom right) compared to the 1991-2020 average. Image by NOAA Climate.gov, based on NCEI data.