
Image caption
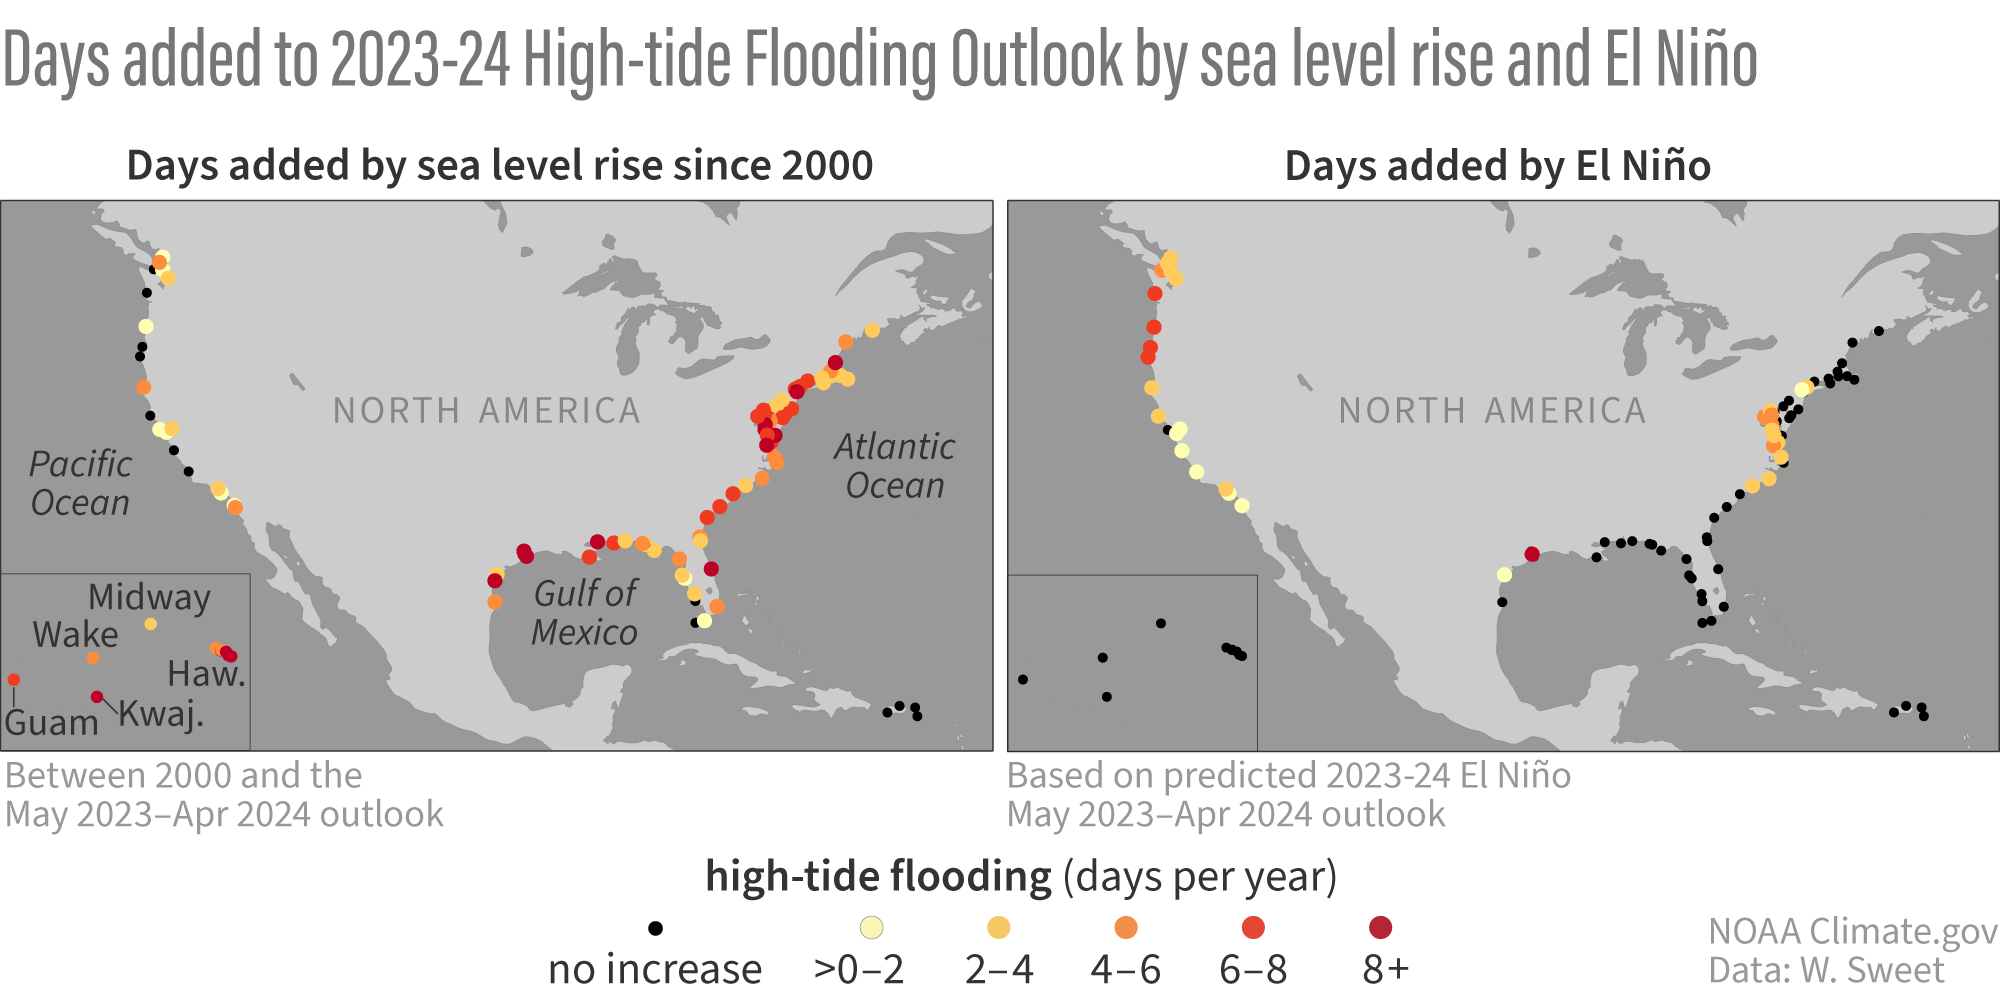
(Left) The additional number of high-tide flooding days in the 2023-24 Outlook, relative to the year 2000 average, attributed to rising sea level trends. (Right) Additional number of high-tide flooding days above and beyond those from sea level rise, shown in the left panel, based upon the predicted 2023-24 El Niño with a 9-month average Oceanic Niño Index (ONI) value of 1.2° C (see footnote #6 for how this was determined). For additional details on how the attribution is calculated, please see Sweet et al. (2018). NOAA Climate.gov graphic, adapted from original by Billy Sweet.