
Image caption
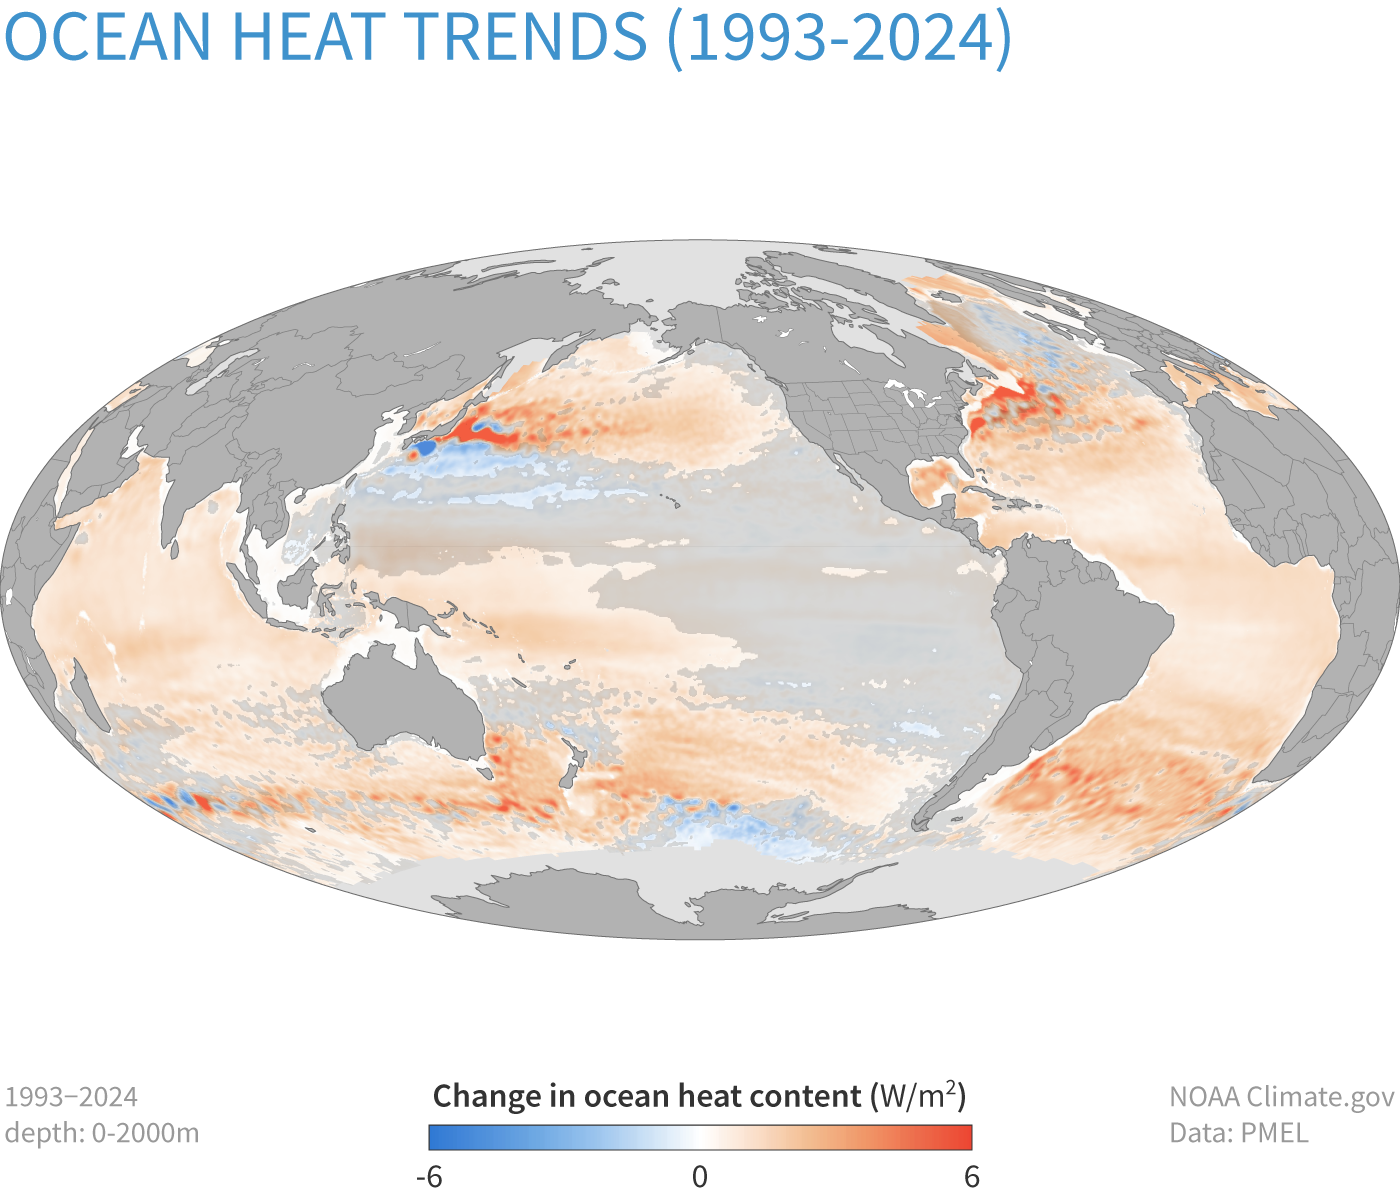
Change in stored heat content in the upper 2,000 meters (1.2 miles) of the ocean from 1993-2024. Darkest orange areas show where heat content increased by 6 or more watts per square meter. Some areas have lost heat (blue), but not enough to offset increases everywhere else. Changes in gray shaded areas were not statistically significant, meaning small relative to the range of natural variability. NOAA Climate.gov image, based on data from John Lyman.