
Image caption
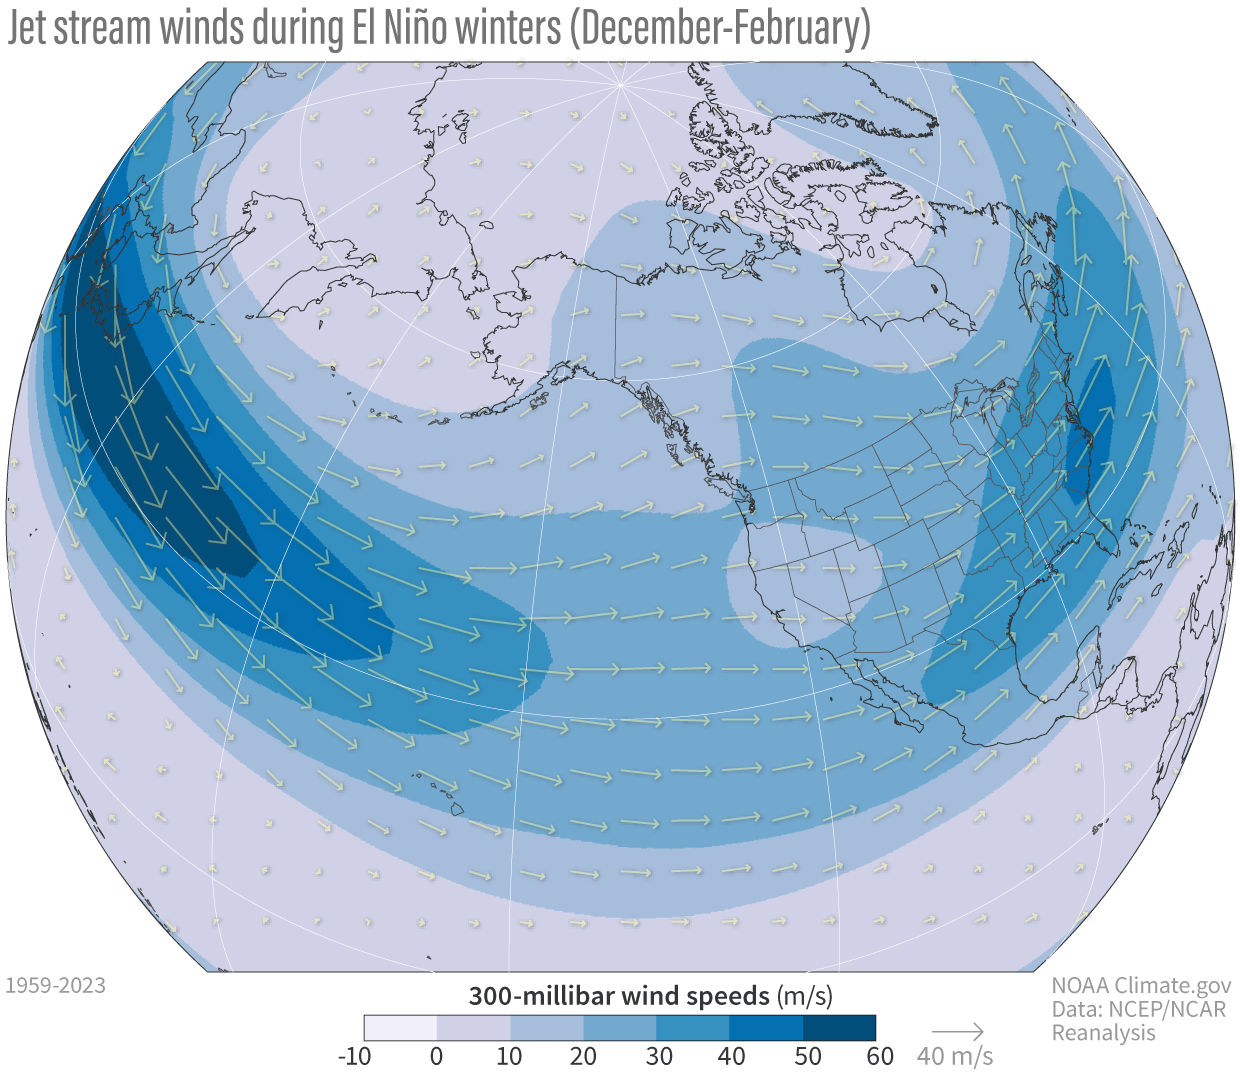
The jet stream pattern during El Niño winters, shown as the average zonal (west-east) wind at 300 millibars (i.e., the altitude at which the pressure is 300 millibars) for all El Niño winters 1959–2023. Shading and arrows both indicate the wind speed. Positive values indicate westerlies (from the west); negative values indicate easterlies (from the east). The core of the jet stream extends farther eastward over the Pacific compared to La Niña winters. NOAA Climate.gov image from NCEP/NCAR Reanalysis data and analysis by Michelle L'Heureux.