
Image caption
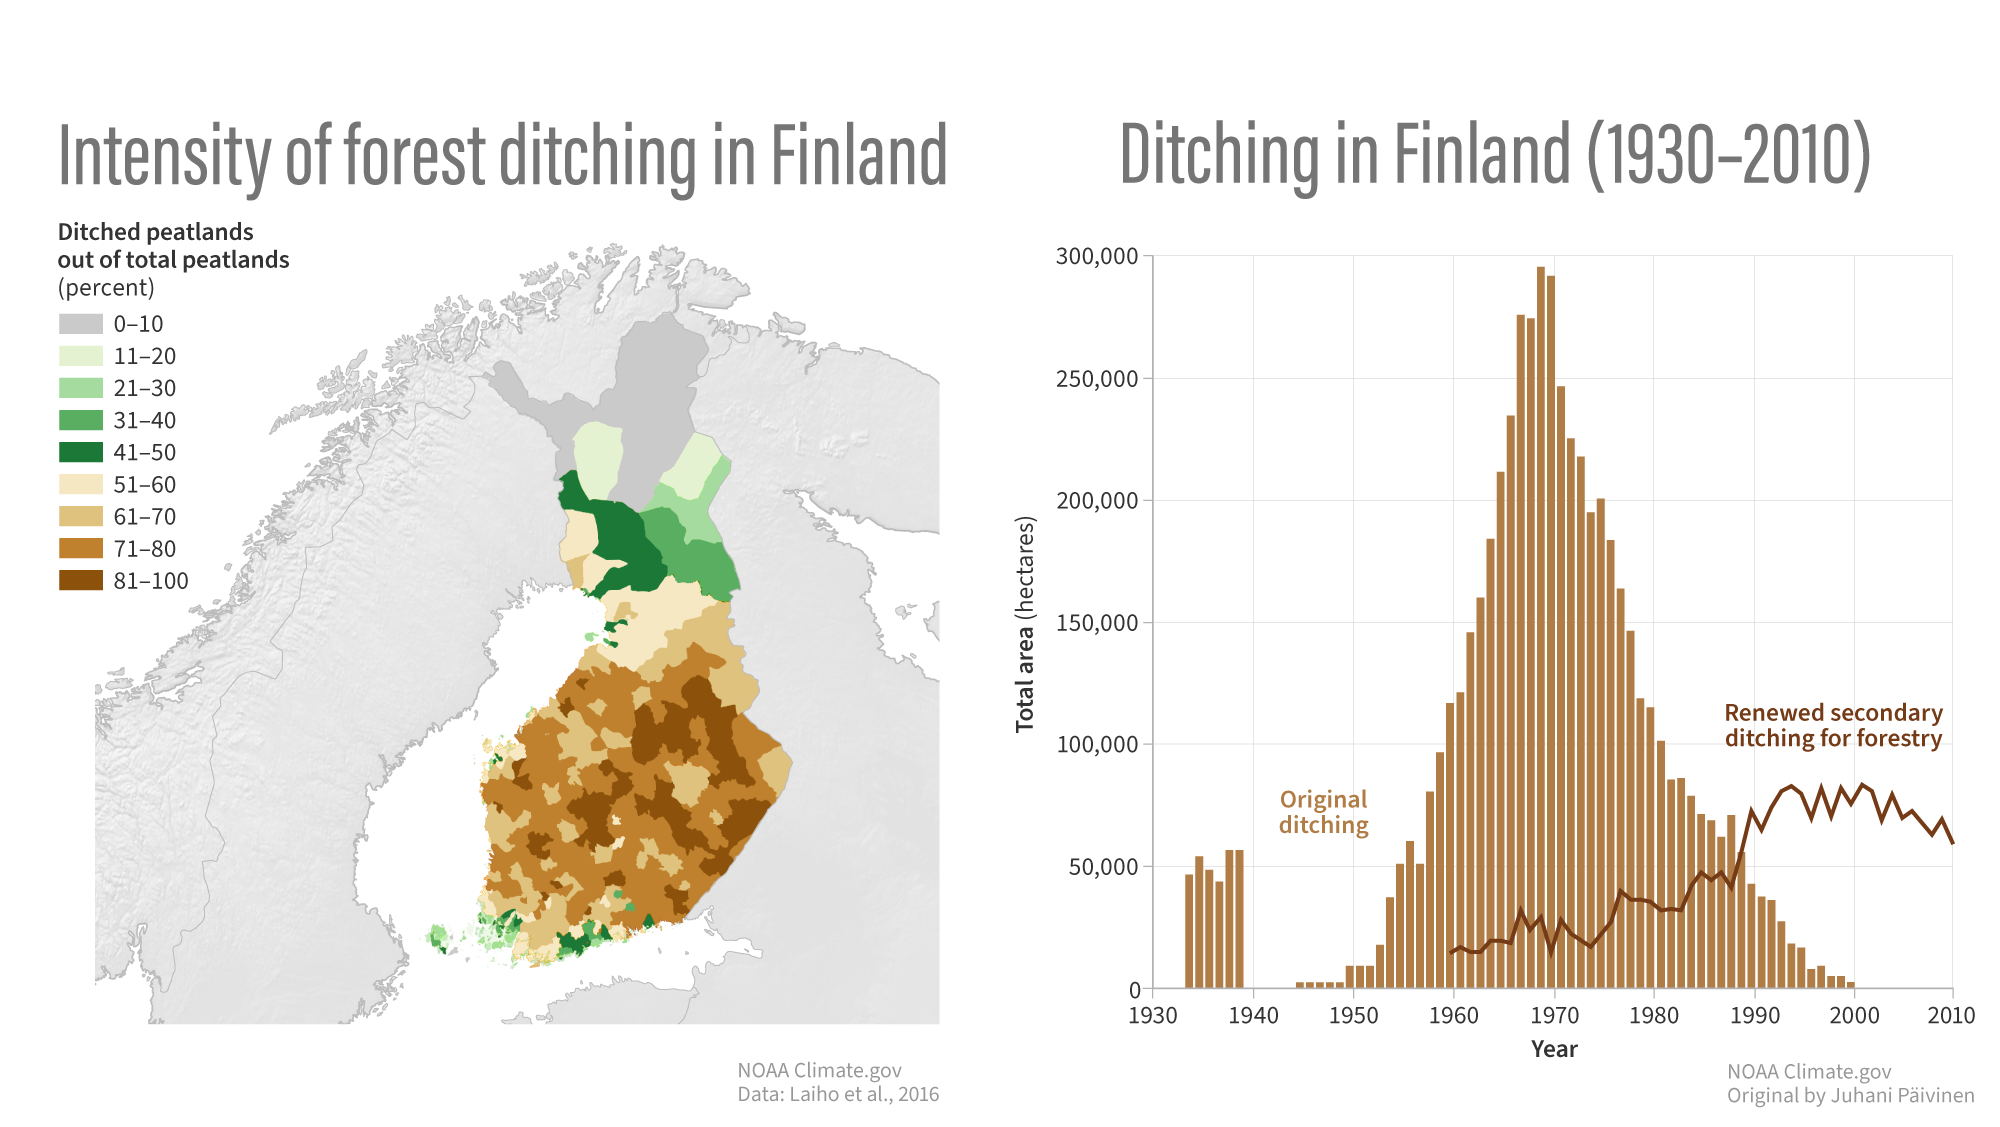
(map) Intensity of ditching in Finland provinces. (graph) Total peatland area undergoing first or secondary ditching over the 20th century, with an interruption during World War 2. NOAA Climate.gov image, adapted from 2023 Arctic Report Card.