
Image caption
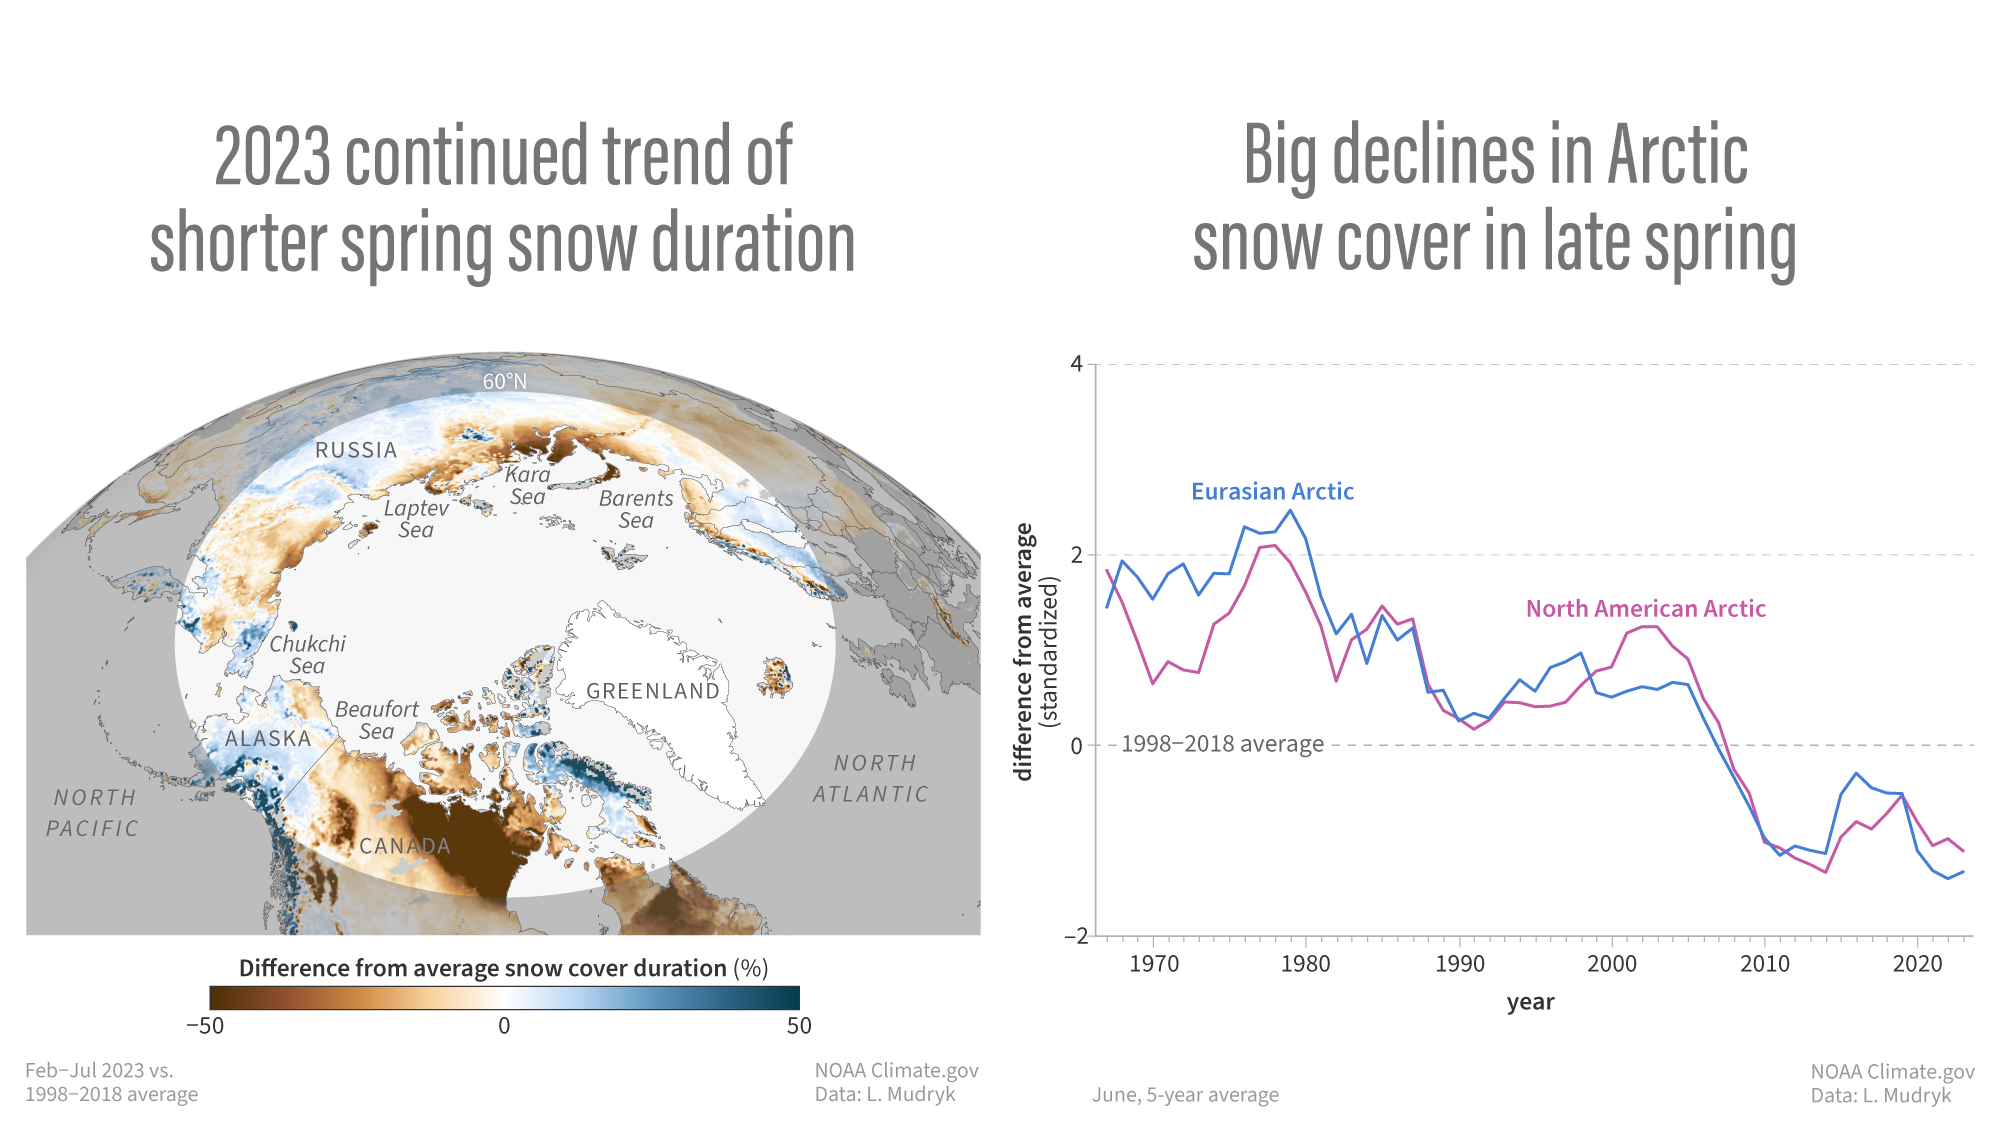
(map) Number of snow-covered days in spring 2023 compared to the 1998–2018 average. (graph) Five-year running average of June snow cover index compared to average since 1967. NOAA Climate.gov image, adapted from 2023 Arctic Report Card.