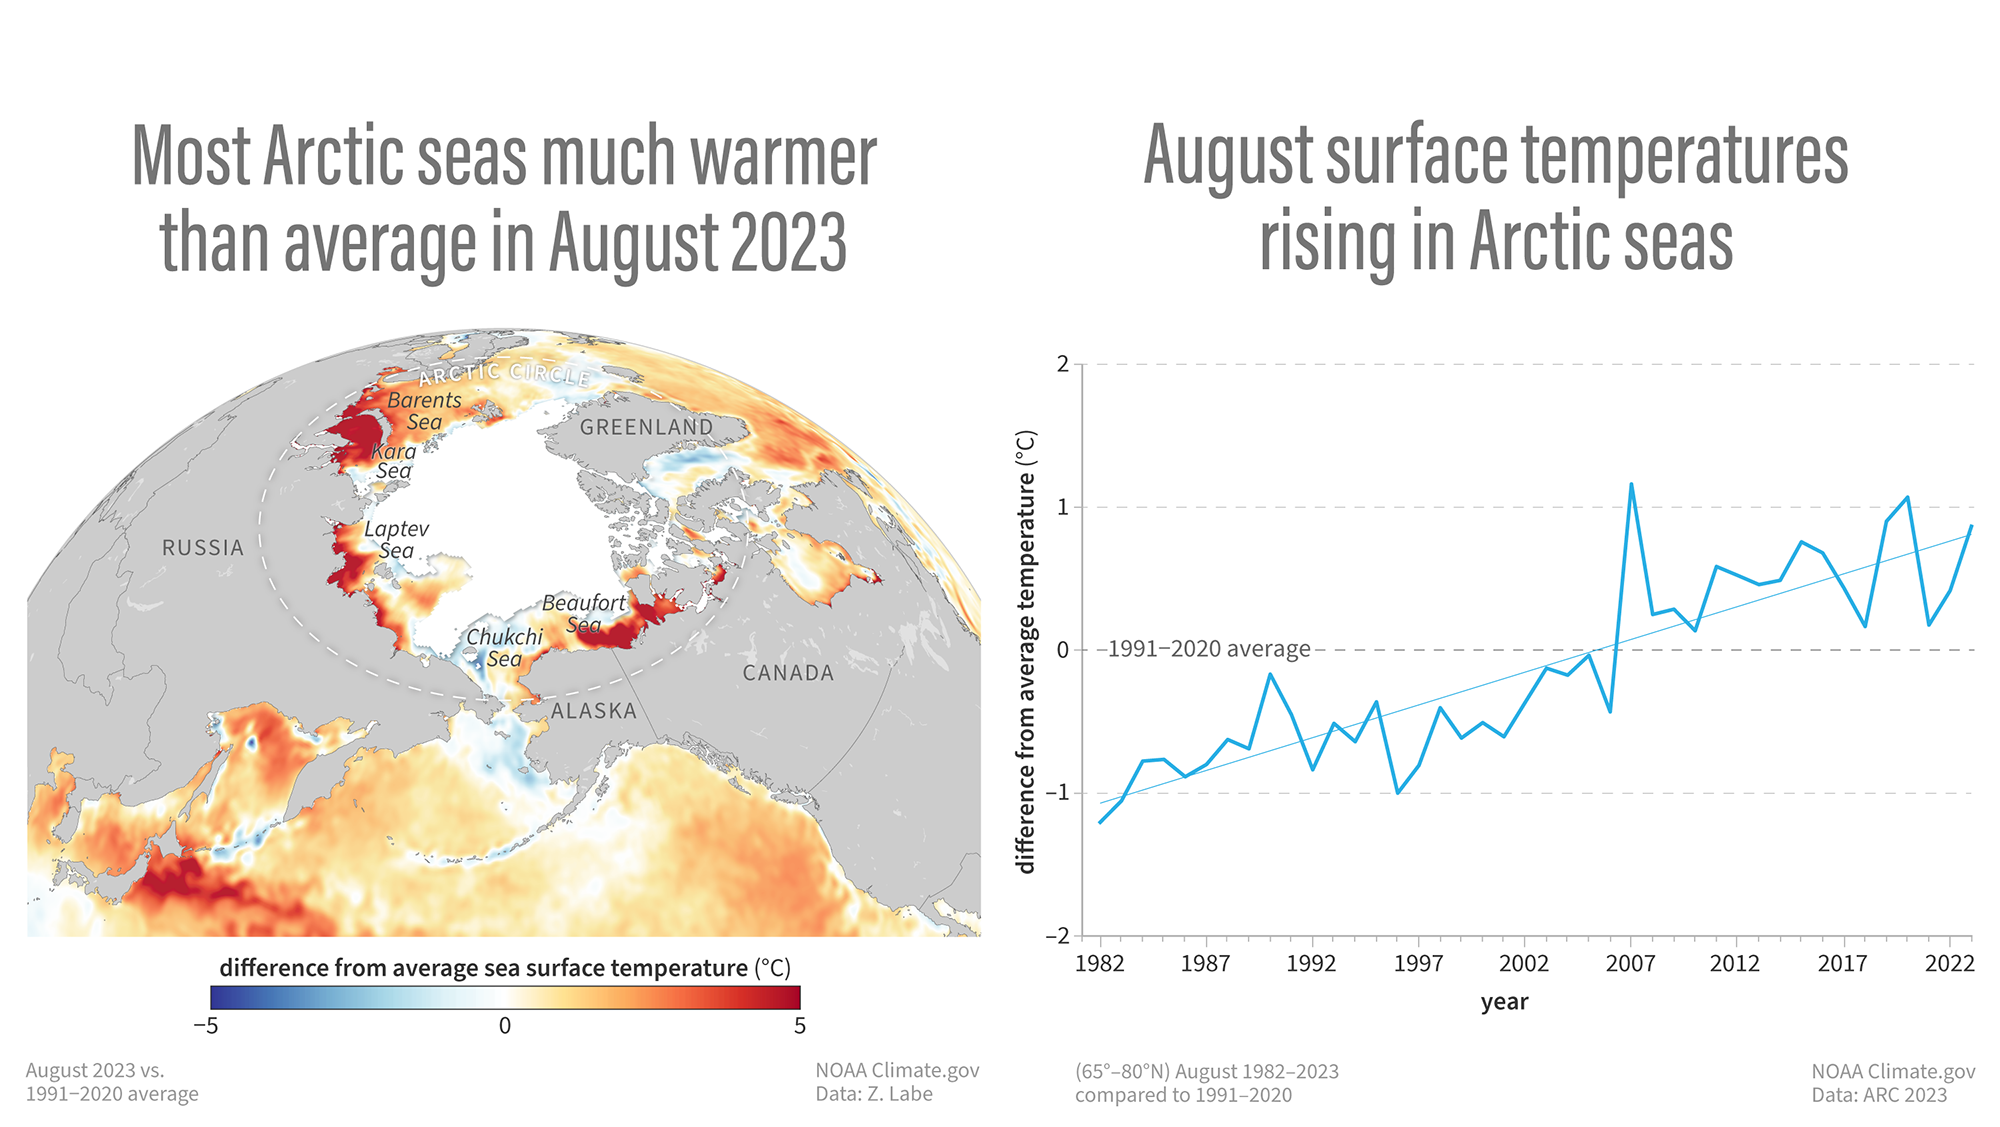
Image caption
(map) Sea surface temperature in ice-free Arctic seas in August 2023 compared to the 1991-2020 average, with places that were warmer than average colored yellow, orange, or red, and places that were cooler than average colored blue. (graph) Average August sea surface temperature for all Arctic seas between 65 and 90 ˚N. NOAA Climate.gov image, adapted from the 2023 Arctic Report Card and based on data provided by Zachary Labe.