
Image caption
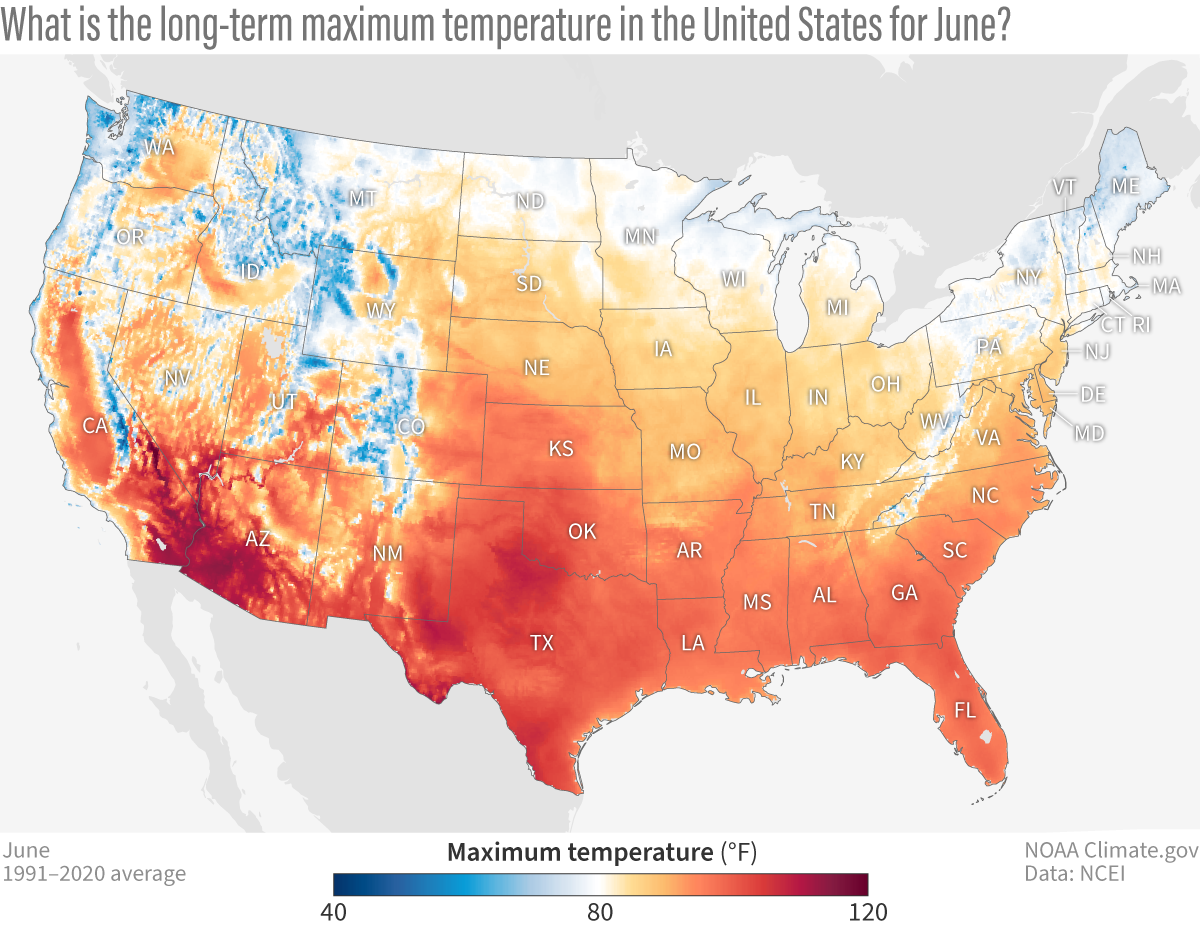
This map shows the long-term average maximum temperature for June, measured from 1991 to 2020. Temperatures indicated by the colors on the map are considered "usual" for afternoons in June.
This map shows the long-term average maximum temperature for June, measured from 1991 to 2020. Temperatures indicated by the colors on the map are considered "usual" for afternoons in June.