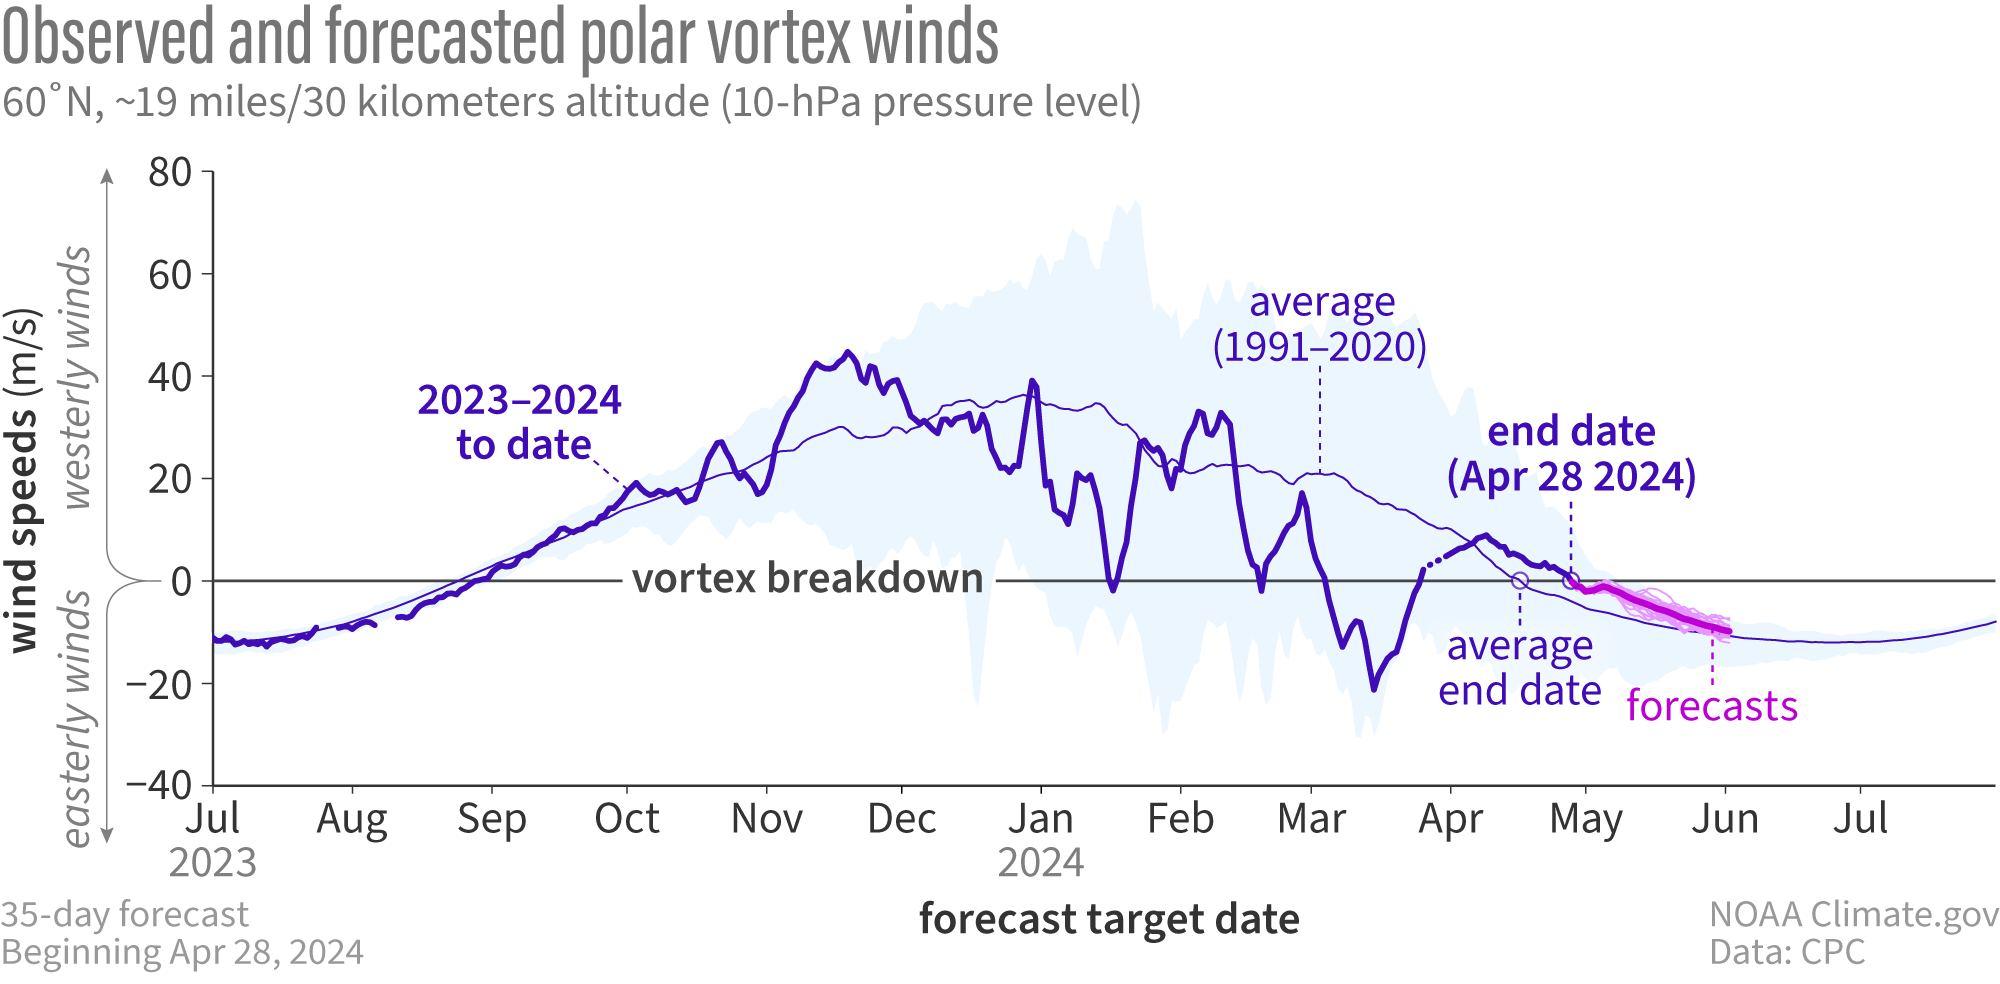
Image caption
Observed and forecasted (NOAA GEFSv12) wind speed at the 10-hPa pressure level and the 60-degrees North latitude circle. The final stratospheric warming occurred on April 28 (where thick magenta line falls below 0 m/s), 16 days later than normal (where the thin purple line falls below 0 m/s and stays there through summer). NOAA Climate.gov image, adapted from original by Laura Ciasto.