Image caption
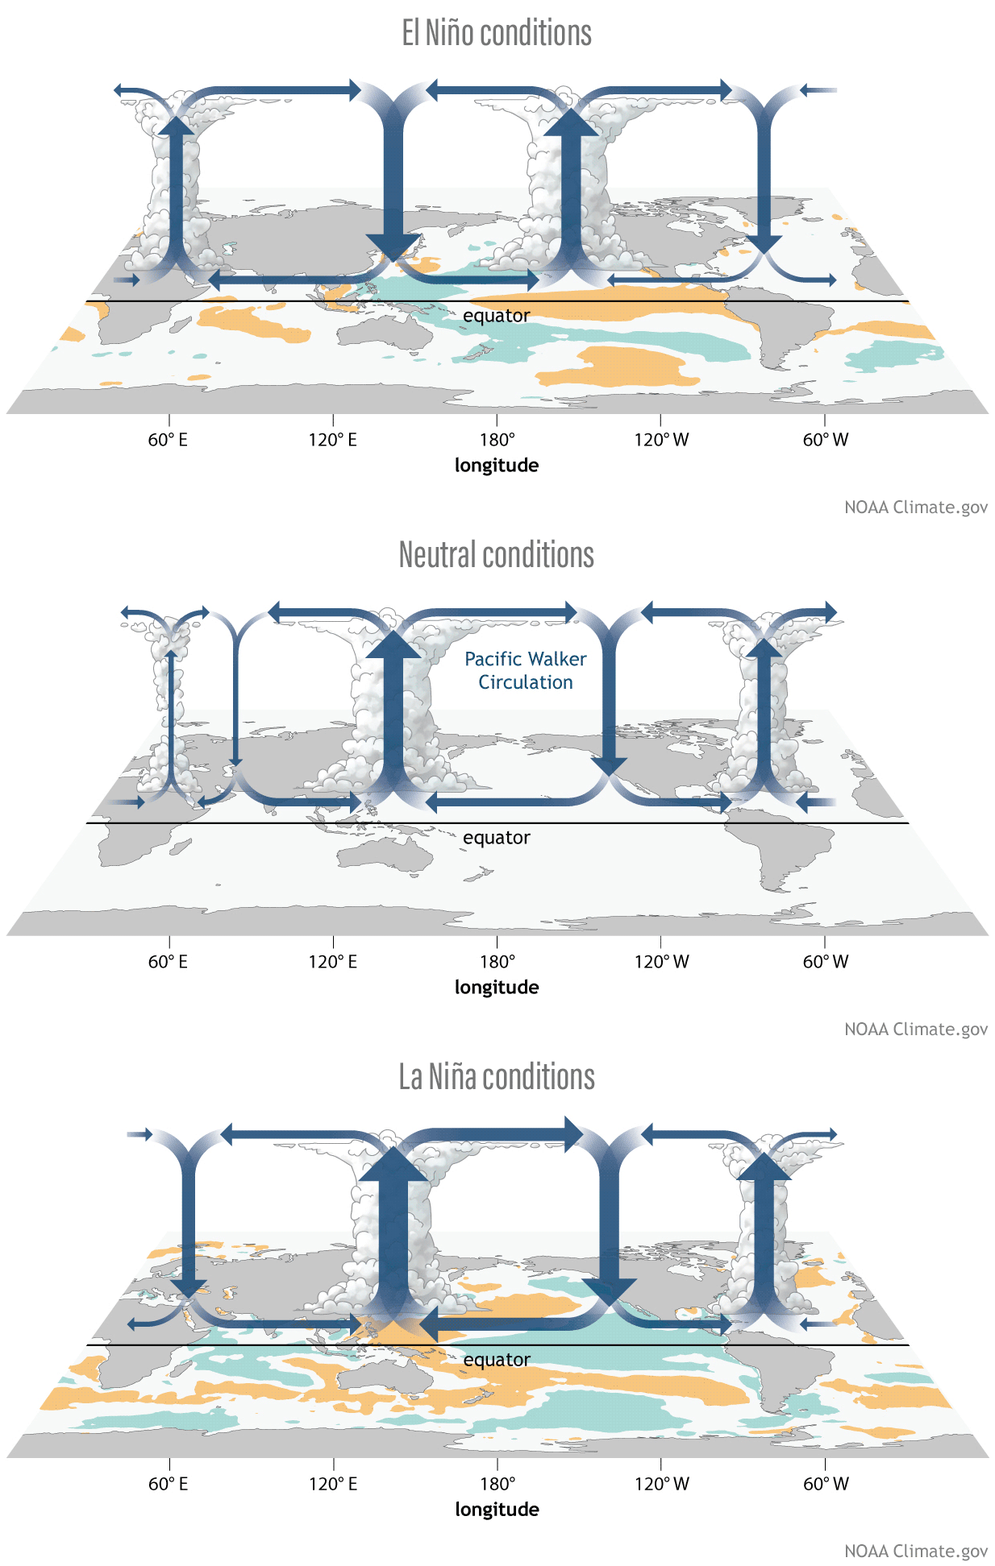
One of the most widely requested and re-used ENSO Blog graphics is this one showing the atmospheric part of ENSO: the Walker Circulation. This animation shows how the areas of convection (rising air) and subsidence (sinking air) change strength and location as sea surface temperatures change during El Niño and La Niña. NOAA Climate.gov graphic.