
Image caption
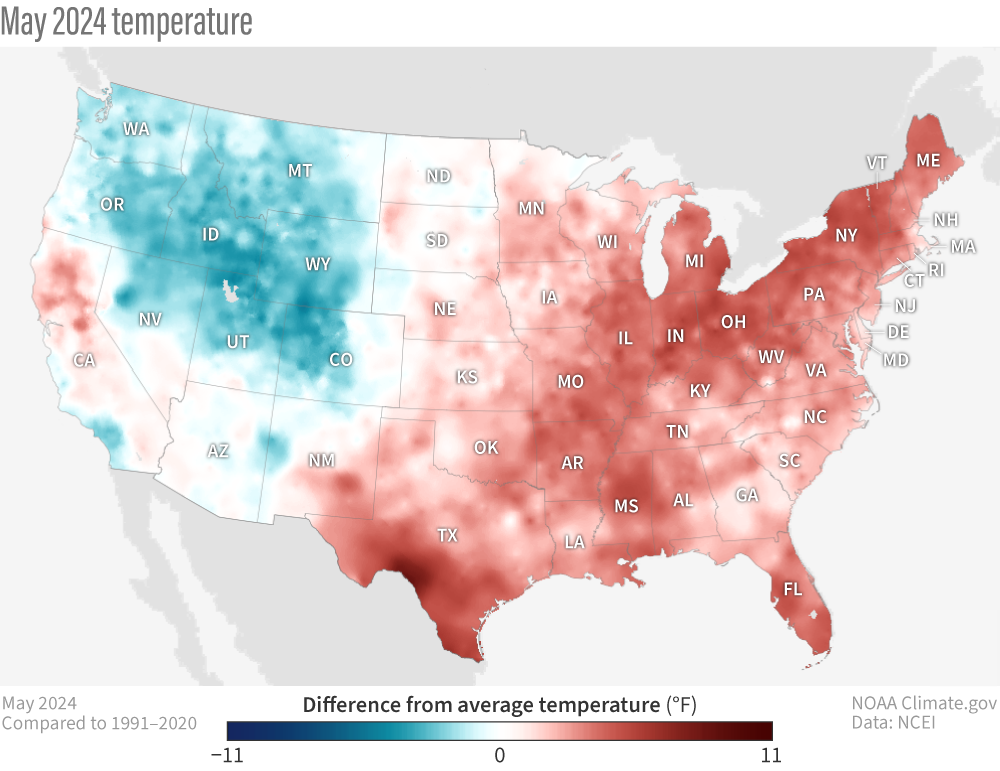
Average temperature in May 2024 compared to normal (1991-2020 average). Places that were warmer than average are red; places that were cooler than average are blue. Much of the eastern part of the country was warmer than average, but a sizeable part of the Northern Rockies was cooler than average for May. NOAA Climate.gov maps from our Data Snapshots: Temperature collection, based on data from NCEI.