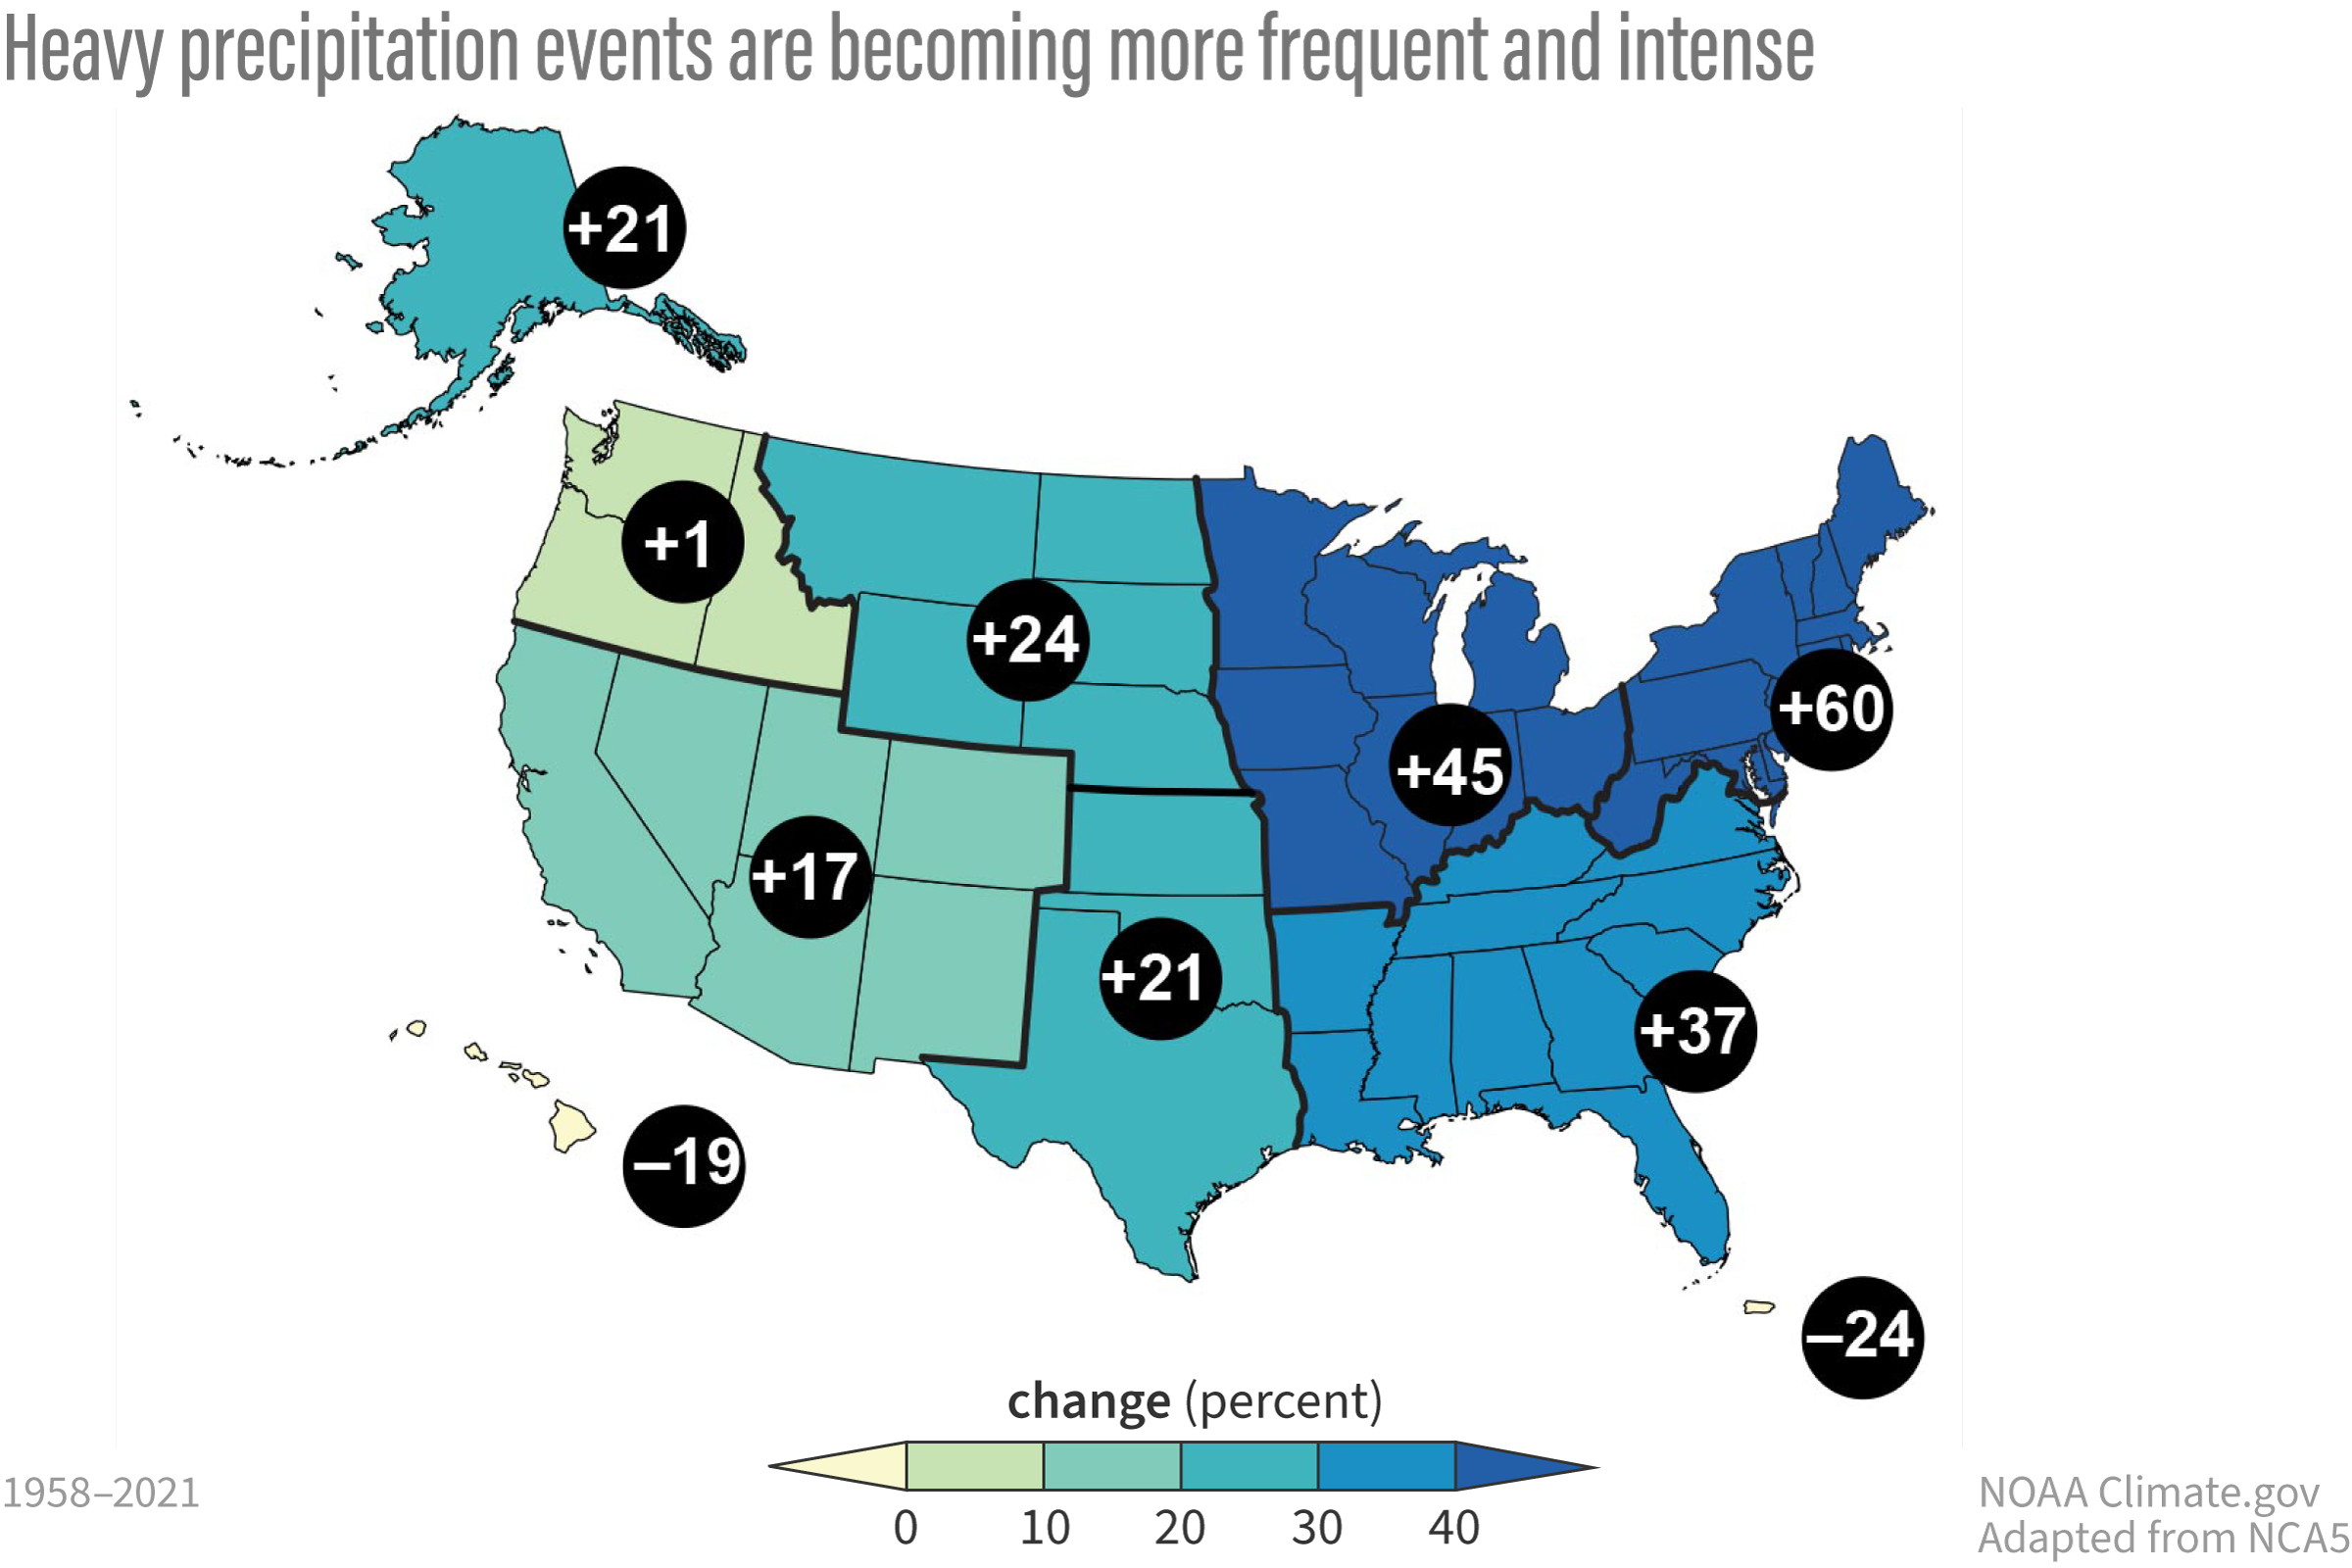
Image caption
Extremely heavy rainfall is increasing across the United states. This map shows observed percent changes in total precipitation falling on the heaviest 1% of rainy days from 1958–2021. Numbers in black circles depict percent changes at the regional level. Data were not available for the US-Affiliated Pacific Islands and the US Virgin Islands. Image adapted from original in the Fifth National Climate Assessment.