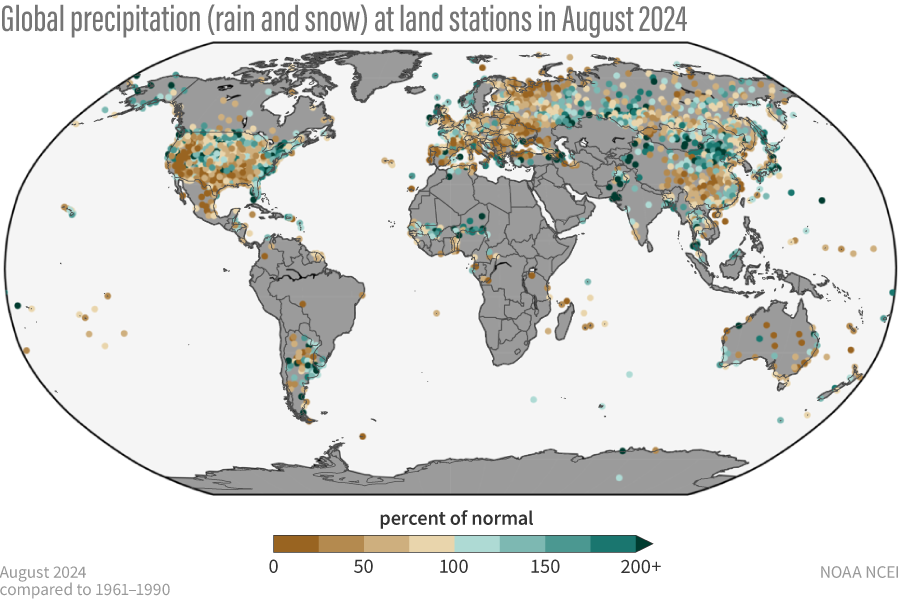
Image caption
Percent of normal precipitation for global land-based stations in August 2024 compared to a baseline of 1961–1990. Places that received more than 100 percent of their average August precipitation are colored green; places that received less than 100 percent of their average August precipitation are colored brown. Gray areas represent missing data. Image by NOAA Climate.gov, based on data from NOAA National Centers for Environmental Information.