
Image caption
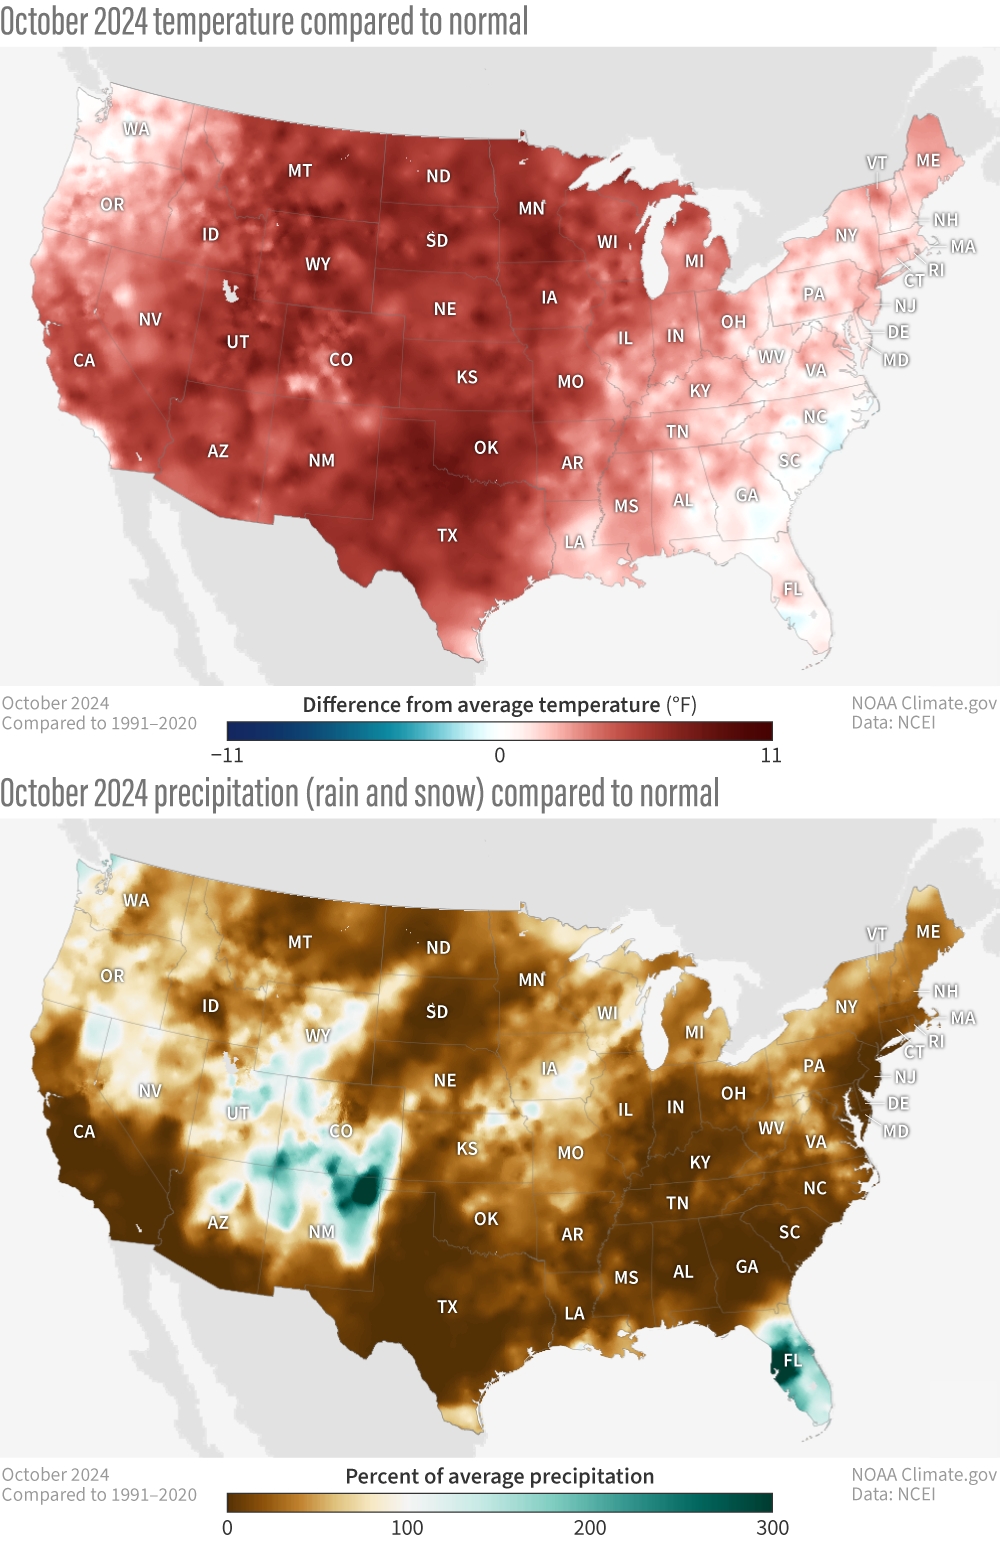
(top) Temperature in October 2024 compared to the 1991-2020 average. Most of the contiguous United States was warmer than average (red). (bottom) Percent of normal October precipitation in 2024. Much of the country was unusually dry (brown). Only a few locations received more than 100 percent of their normal October precipitation (blue green). NOAA Climate.gov maps from our Data Snapshots collection.