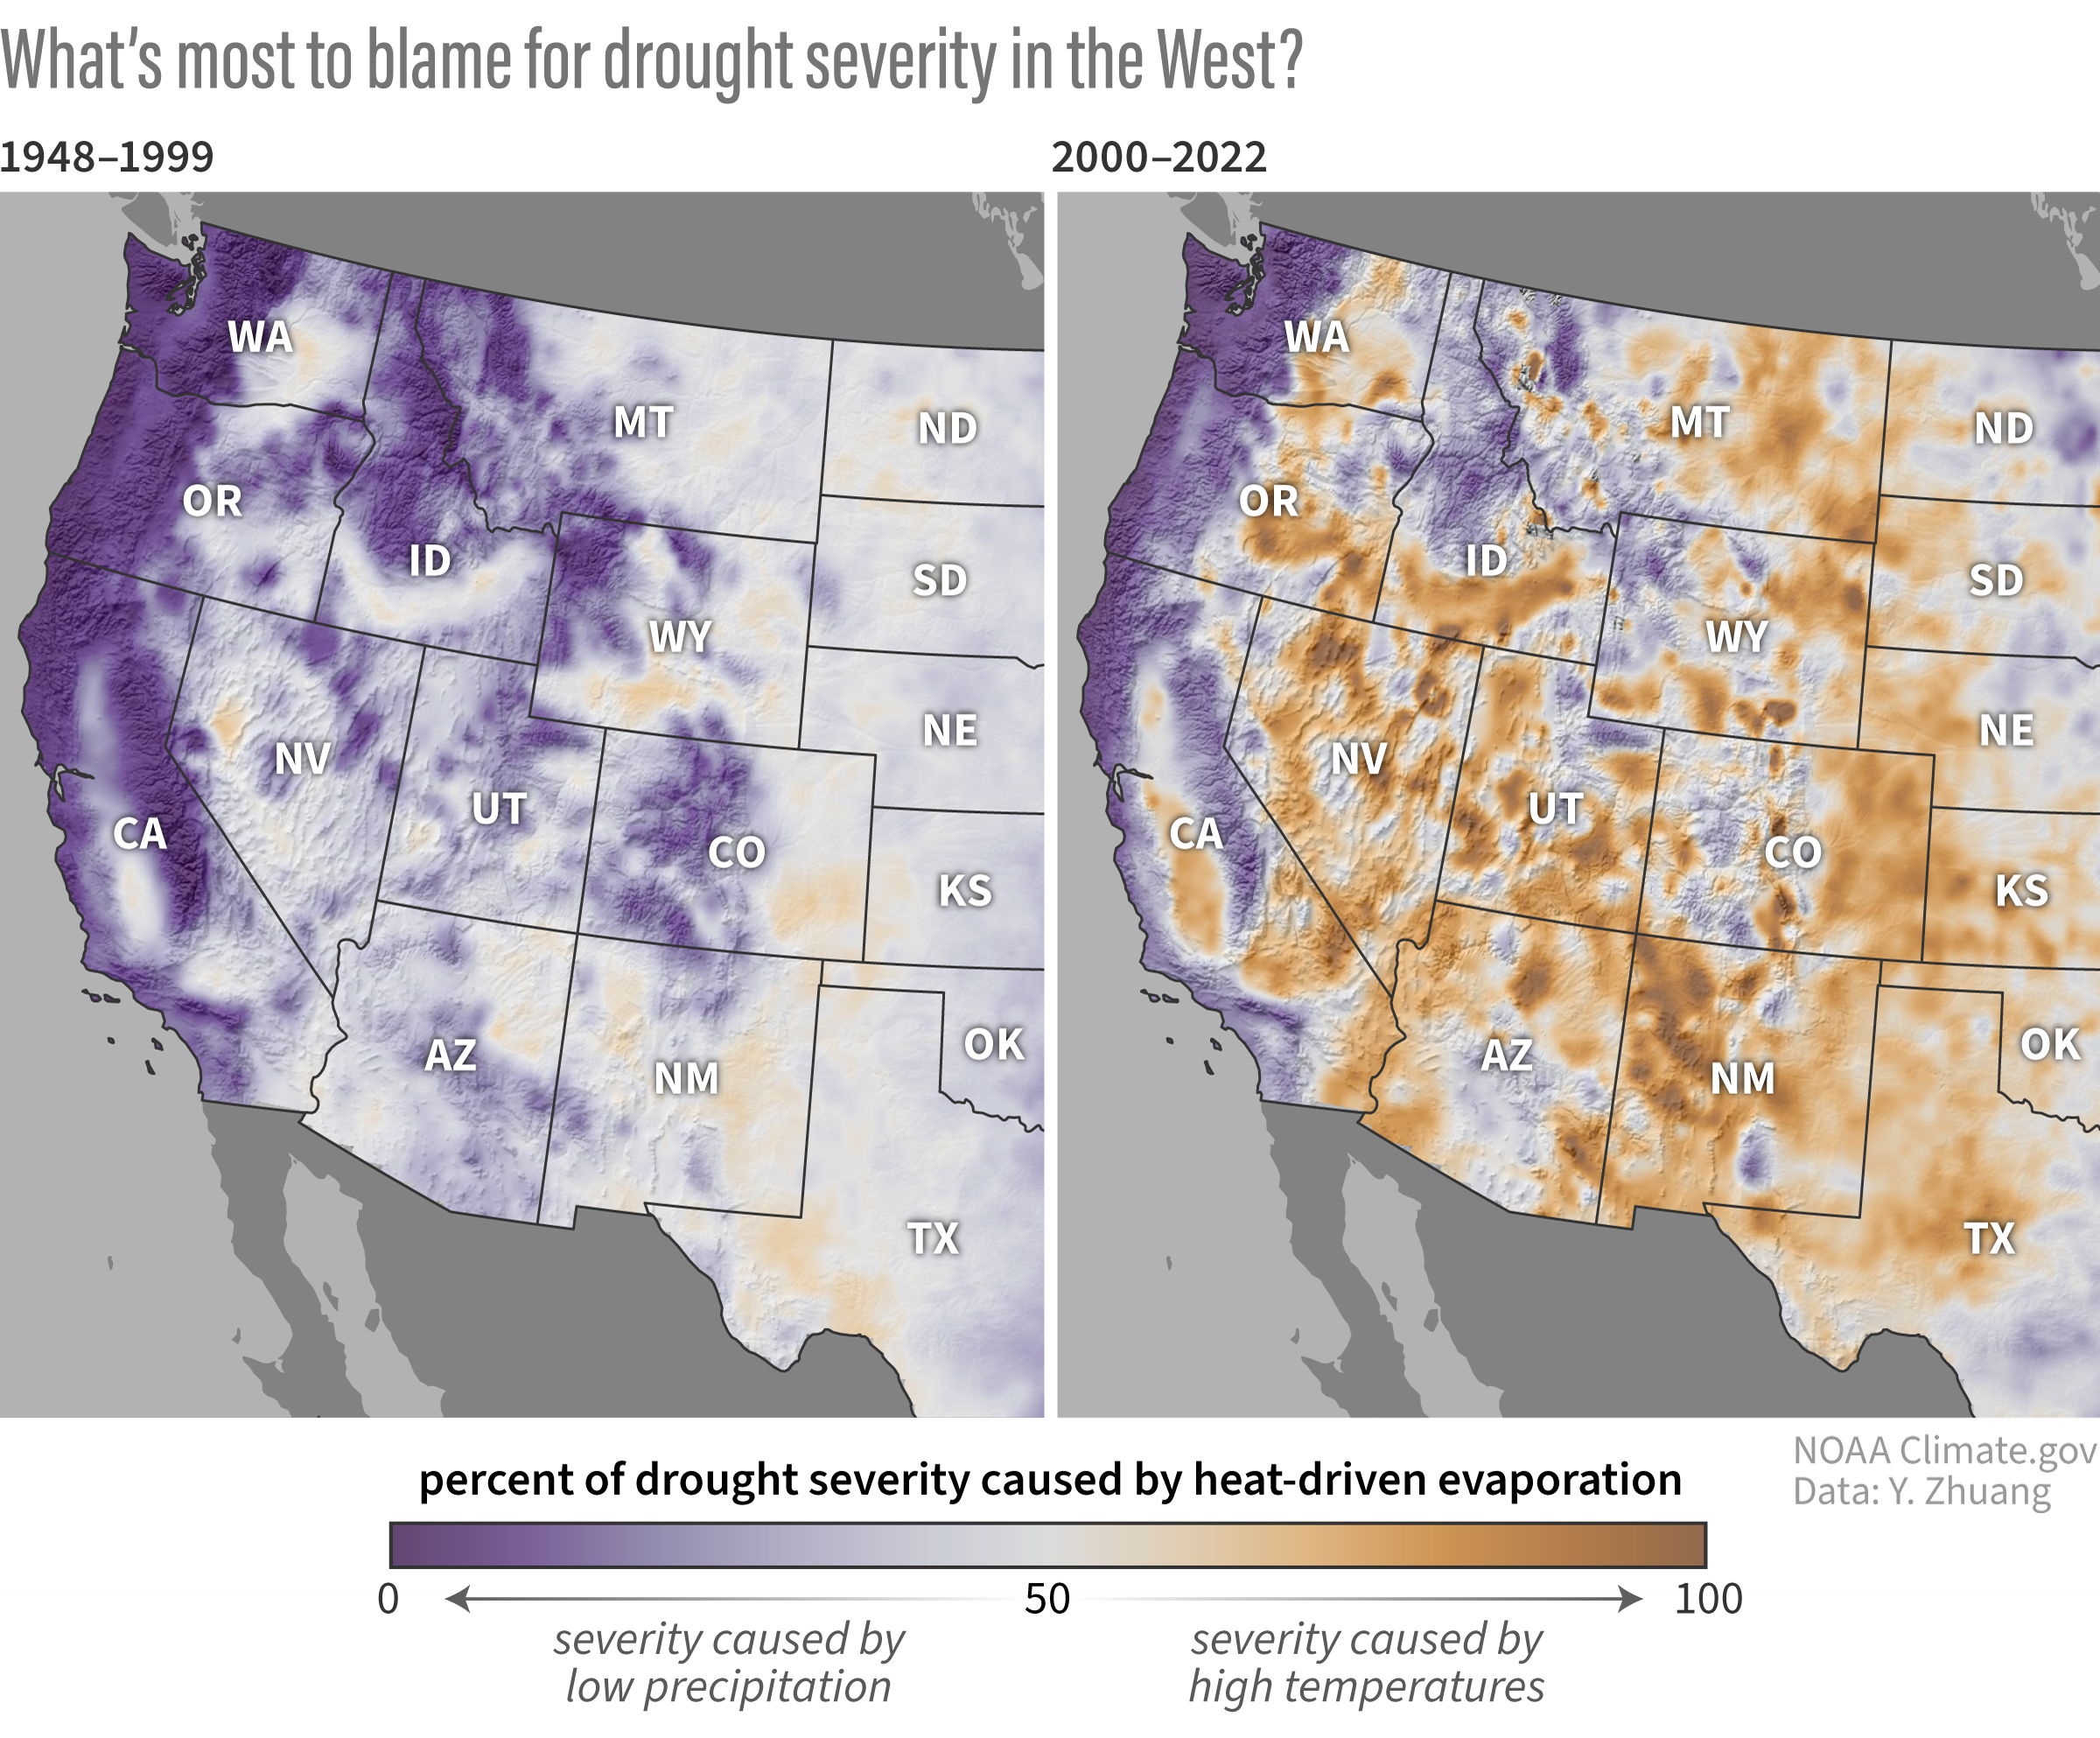
Image caption
These maps compare the contribution of heat-driven evaporation to the intensity of Western droughts in the second half of the 20th century (left, 1948-1999) and the first two decades of the 21st century (2000-2022). Places colored purple indicate heat’s contribution to drought intensity was less than 50%: historic droughts were largely driven by lack of precipitation. Orange colors indicate places where evaporation due to high temperatures contributed more than 50% of the intensity of historic droughts at that location. NOAA climate.gov image, based on data provided by Yizhou Zhuang.