
Image caption
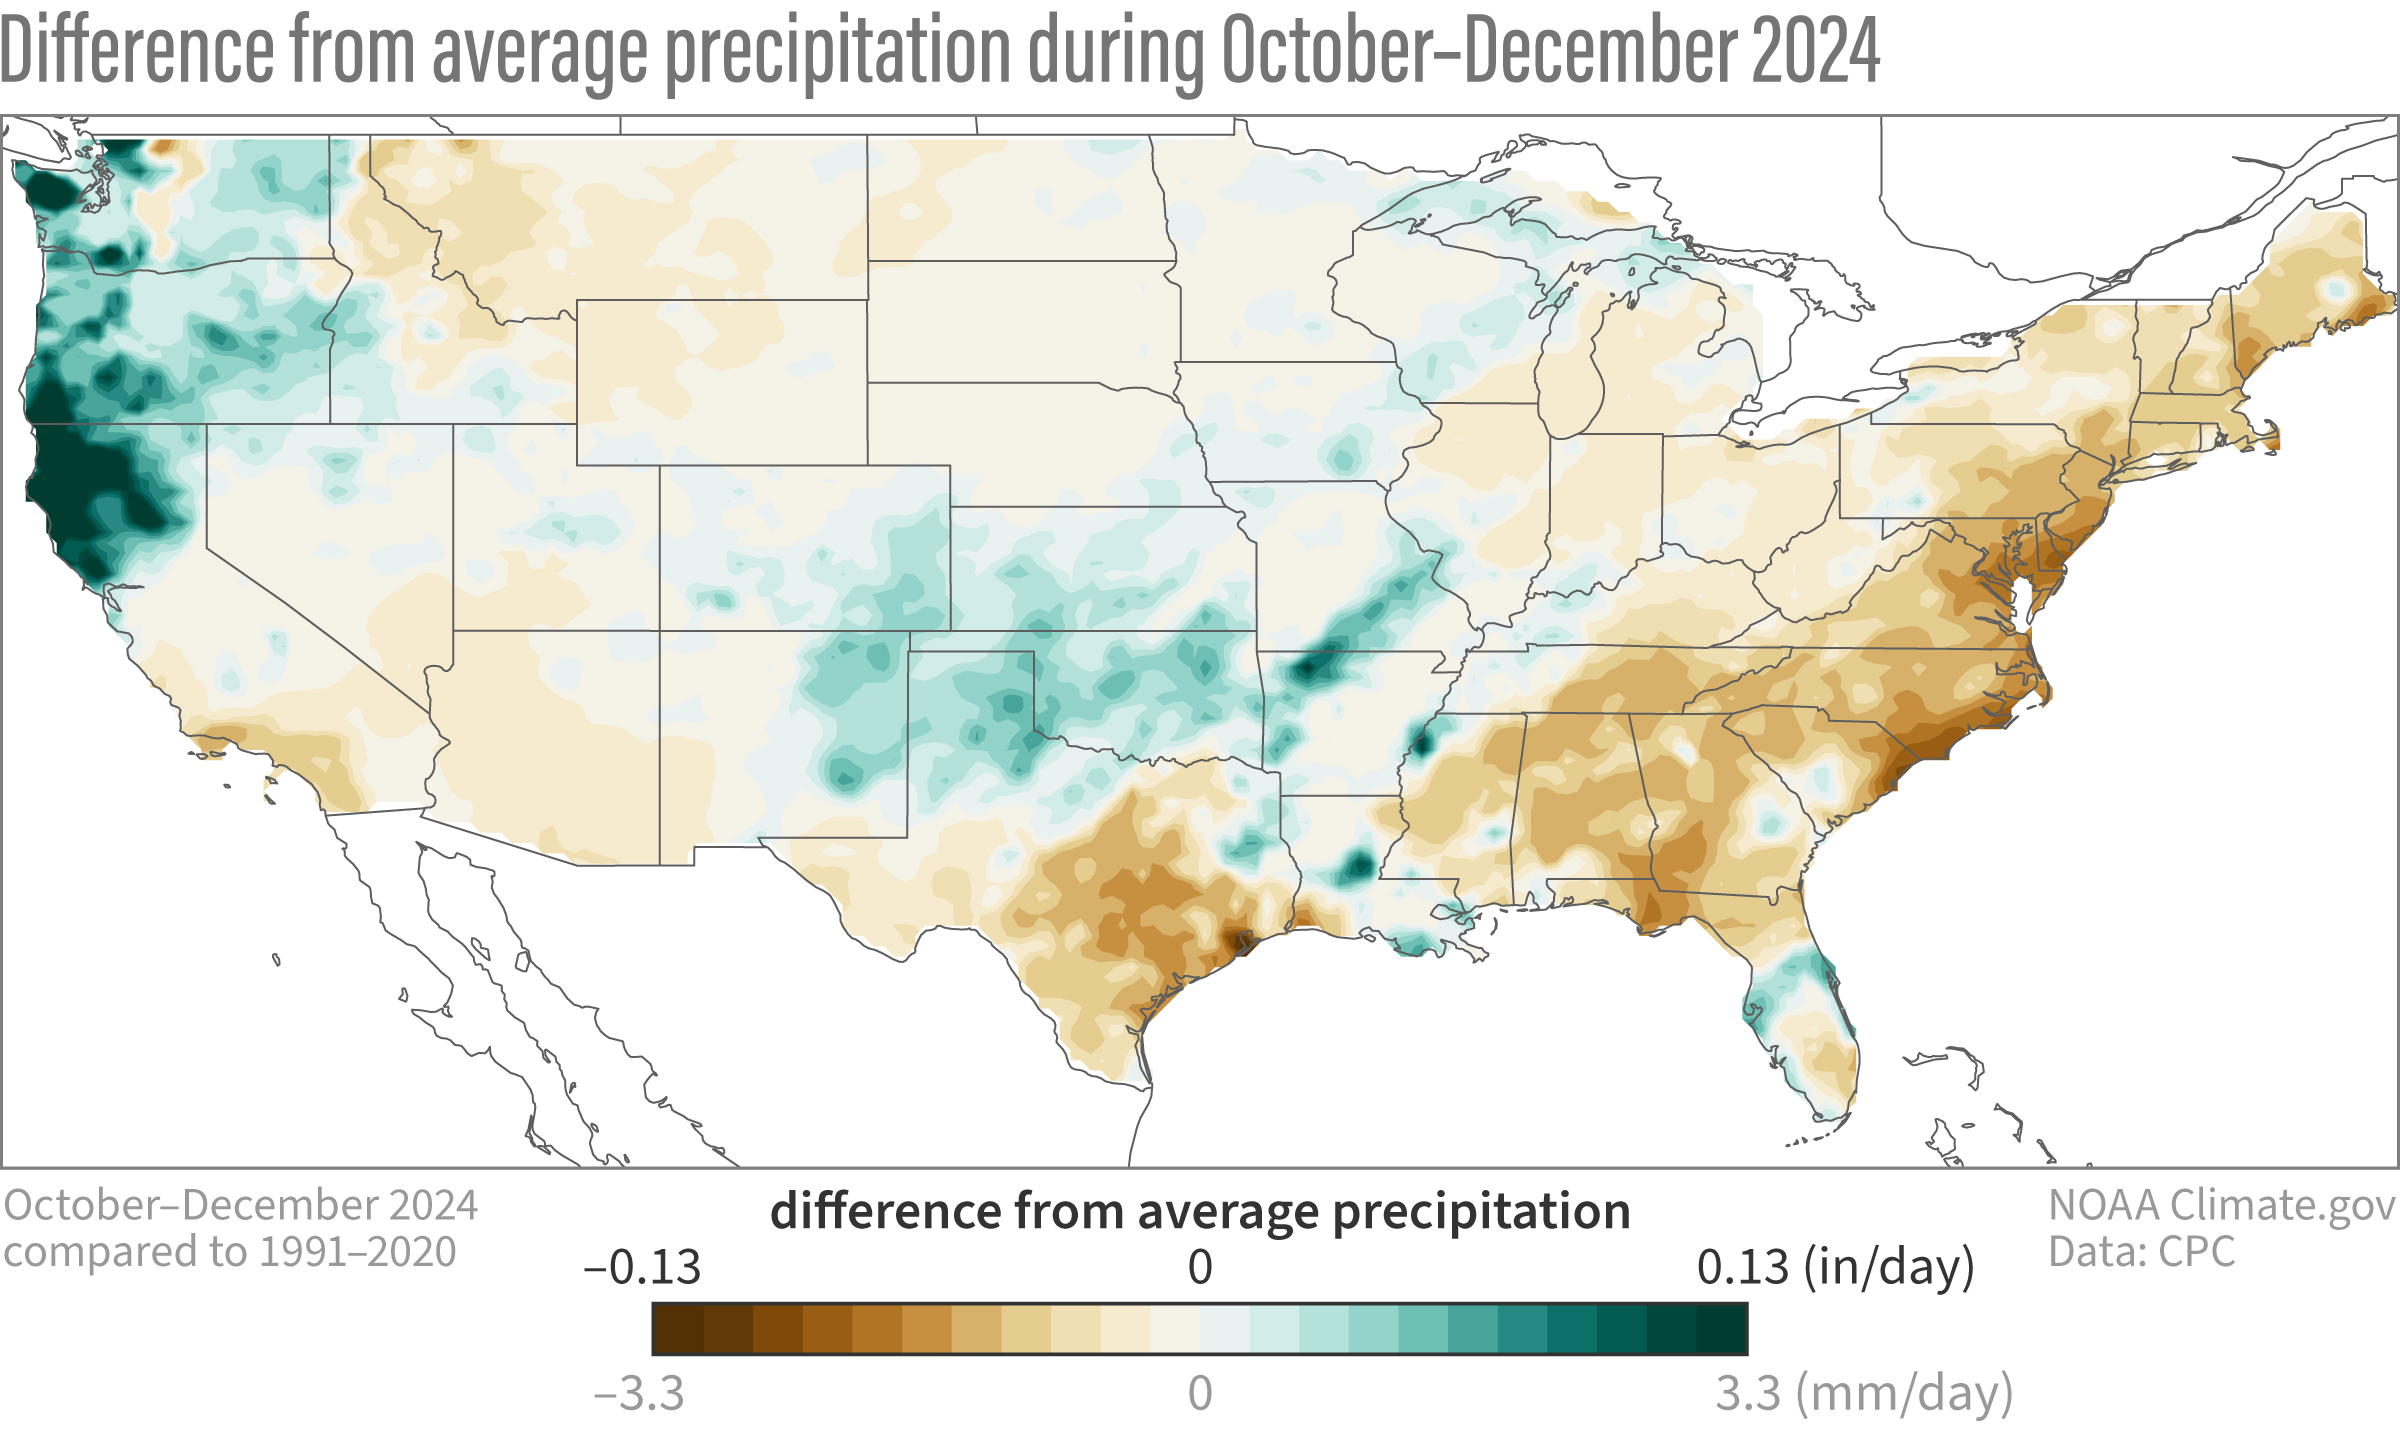
Map showing the difference from average precipitation during October–December 2024. Green areas received more rain and snow than the 1991–2020 average, while brown areas received less. The pattern here resembles what we would expect in October–December during La Niña. Map by climate.gov from CPC data.