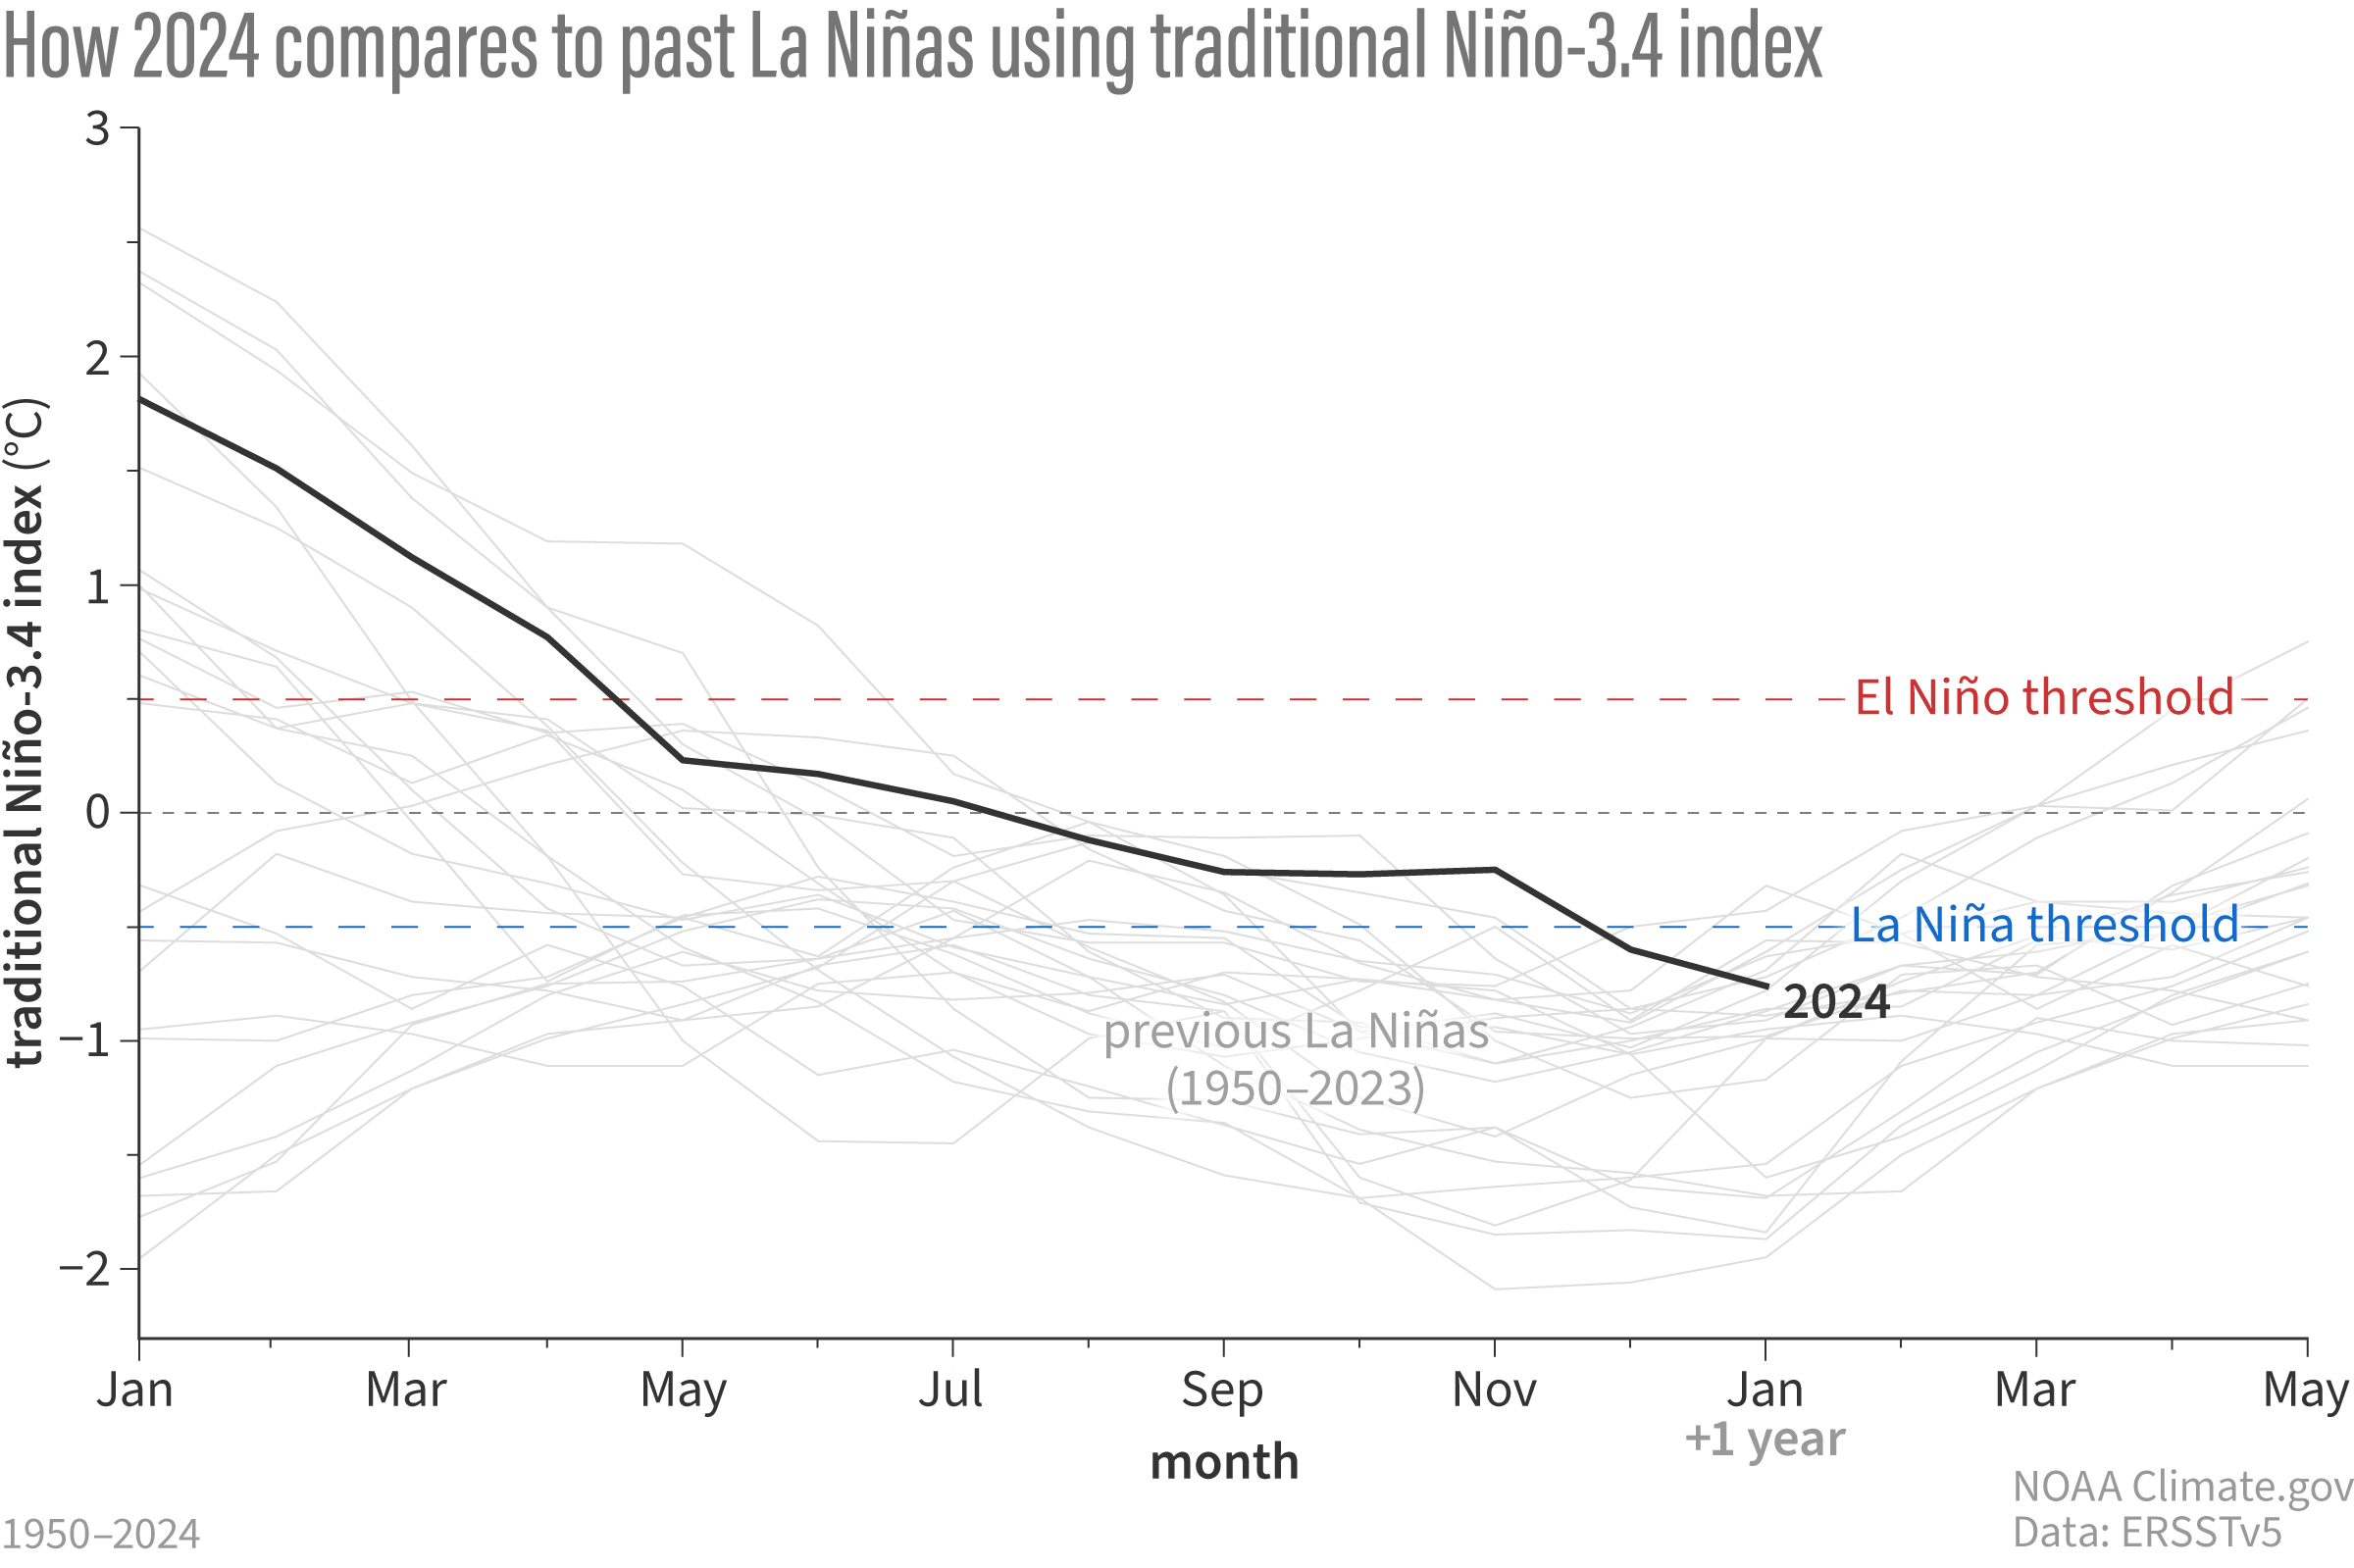
Image caption
How sea surface temperatures in the Niño-3.4 region of the tropical Pacific changed over the course of all La Niña events since 1950 (gray lines) and 2024-25 (black line). This shows the traditional calculation for Niño-3.4, the monthly temperature compared to the most recent 30-year average (1991–2020 for the 2024 line). By this measure, the La Niña threshold was crossed in December 2024, but La Niña remains weak. Climate.gov graph, based on data from Michelle L’Heureux from CPC using ERSSTv5.