
Image caption
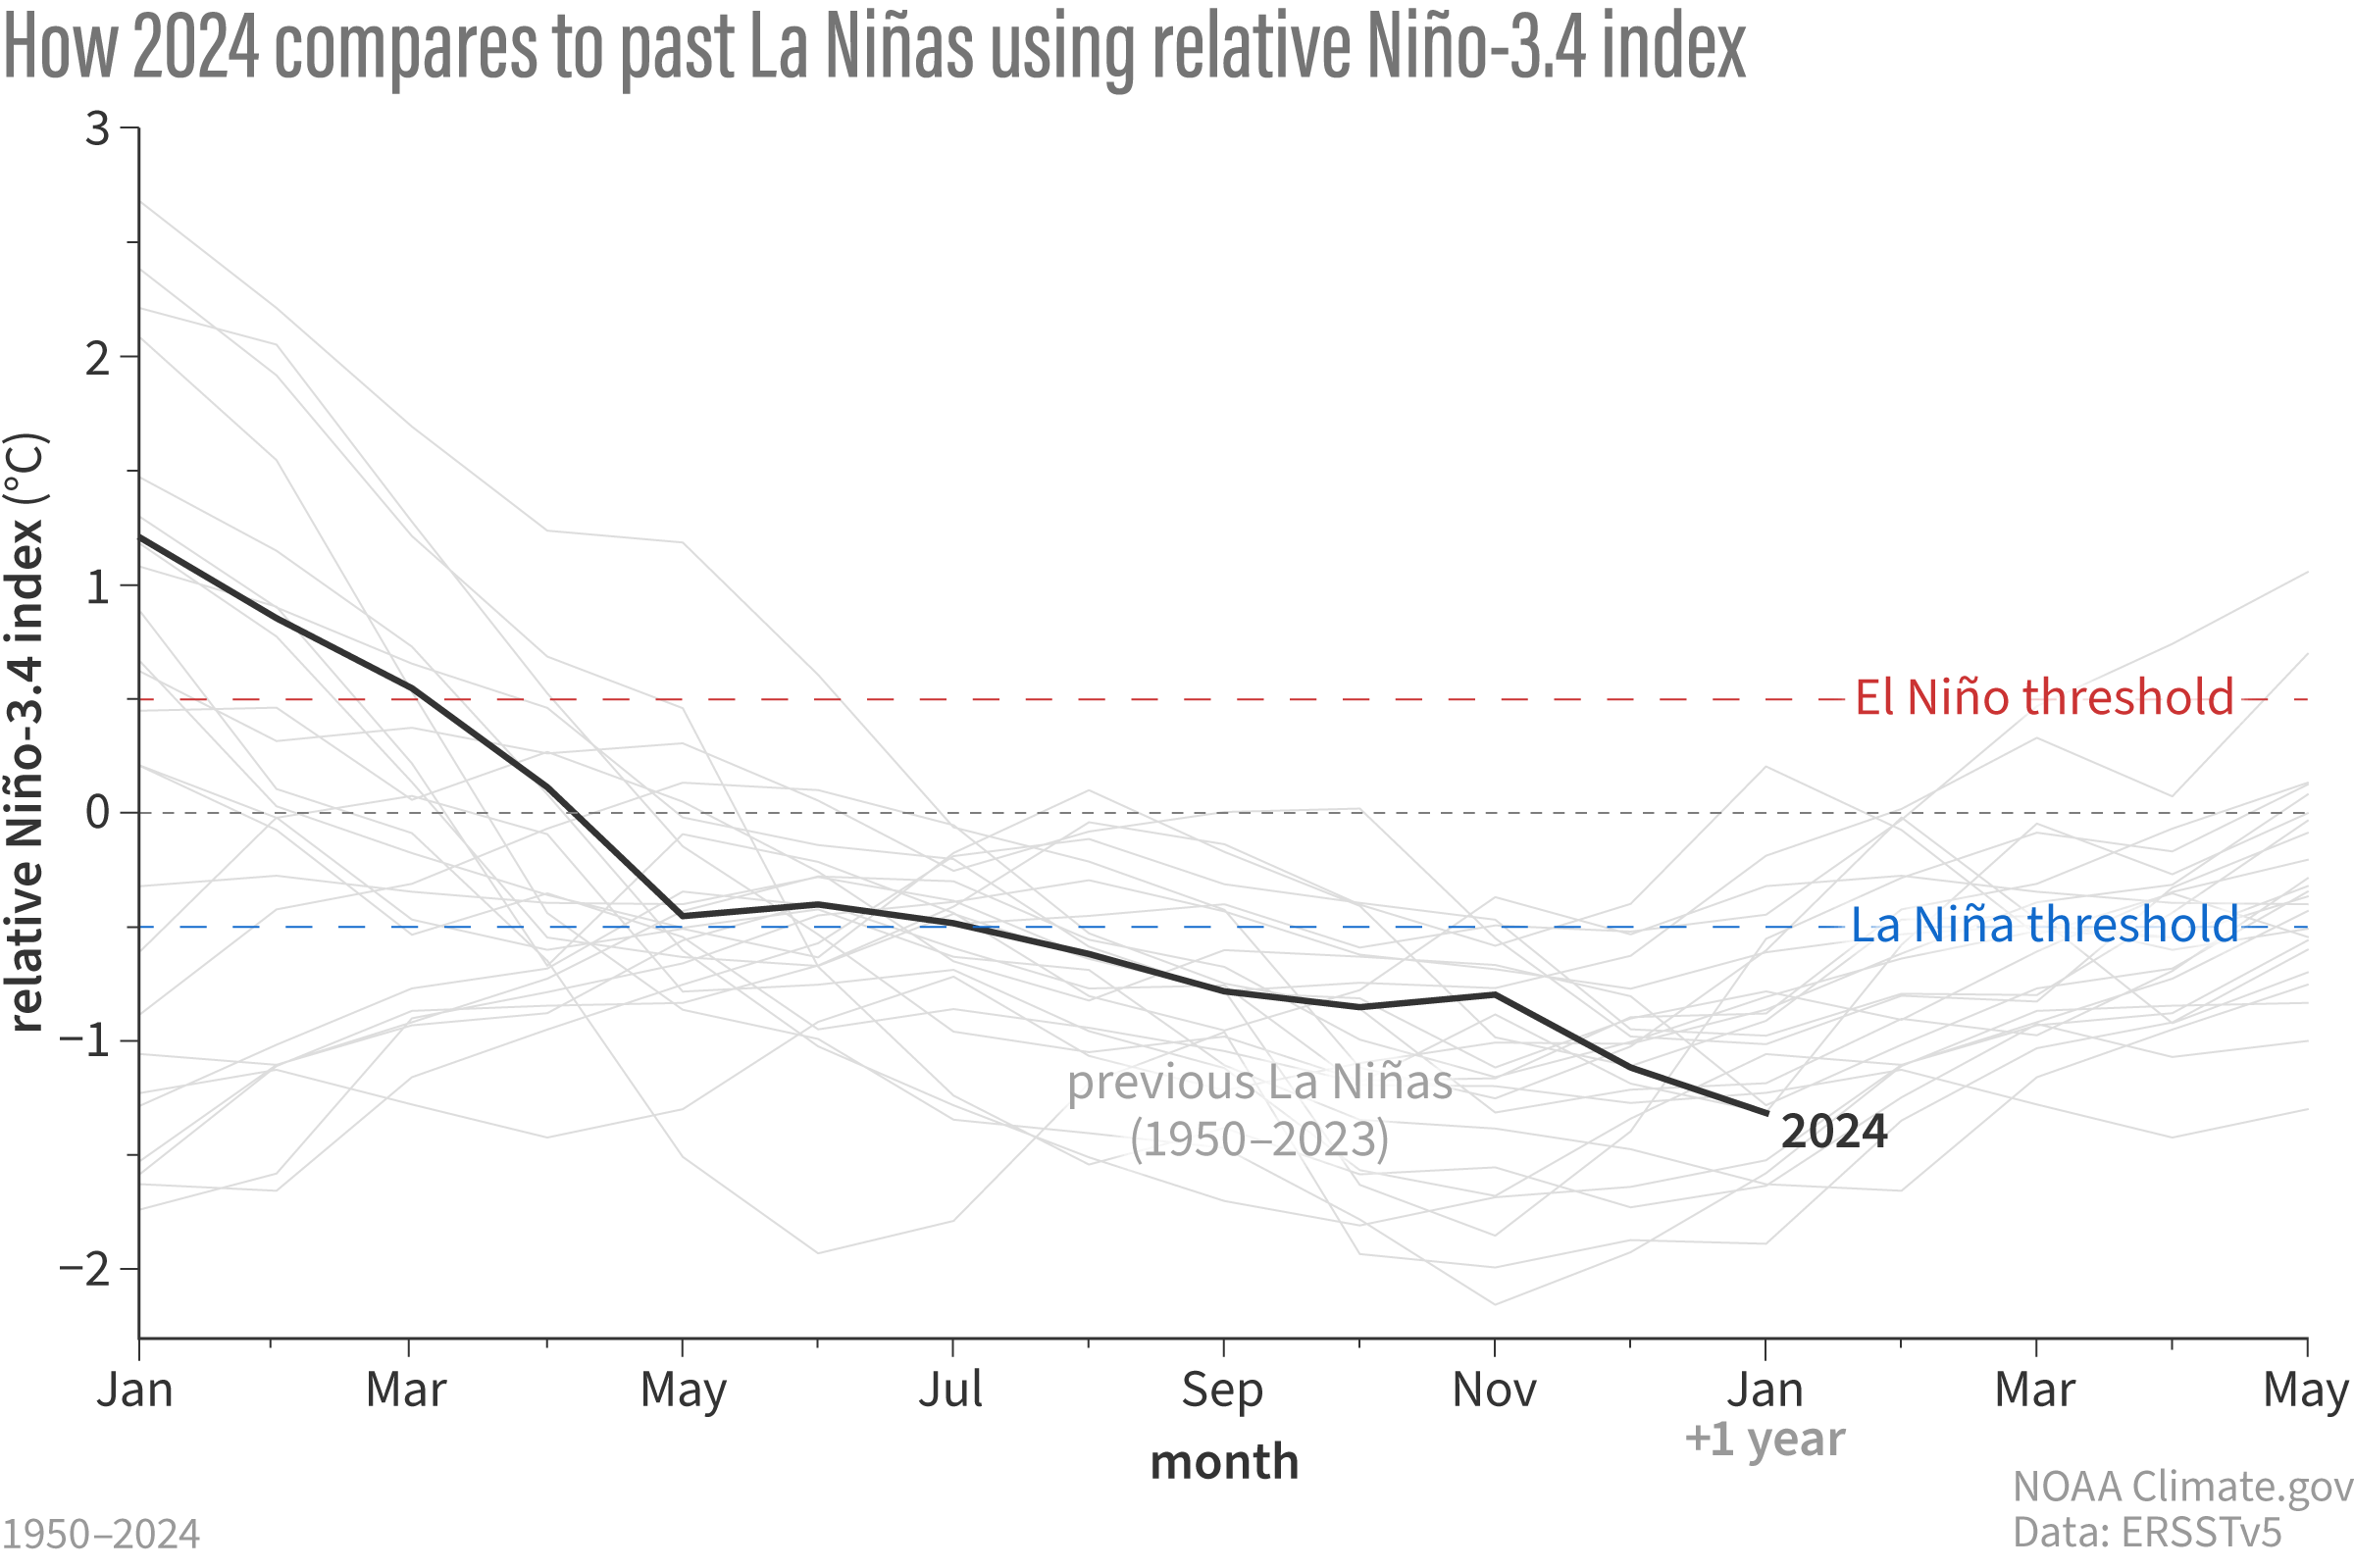
How sea surface temperatures in the Niño-3.4 region of the tropical Pacific changed over the course of all La Niña events since 1950 (gray lines) and 2024 (black line), based on the relative Niño-3.4 calculation. Here, the monthly temperature is compared to the most recent 30-year average, but then the tropical average ocean surface temperature is subtracted, to account for global ocean warmth. By this measure, La Niña conditions are stronger than by the traditional measure. The relative Niño-3.4 index is not our official metric, though, and it needs more research. Climate.gov graph, based on data from Michelle L’Heureux.