
Image caption
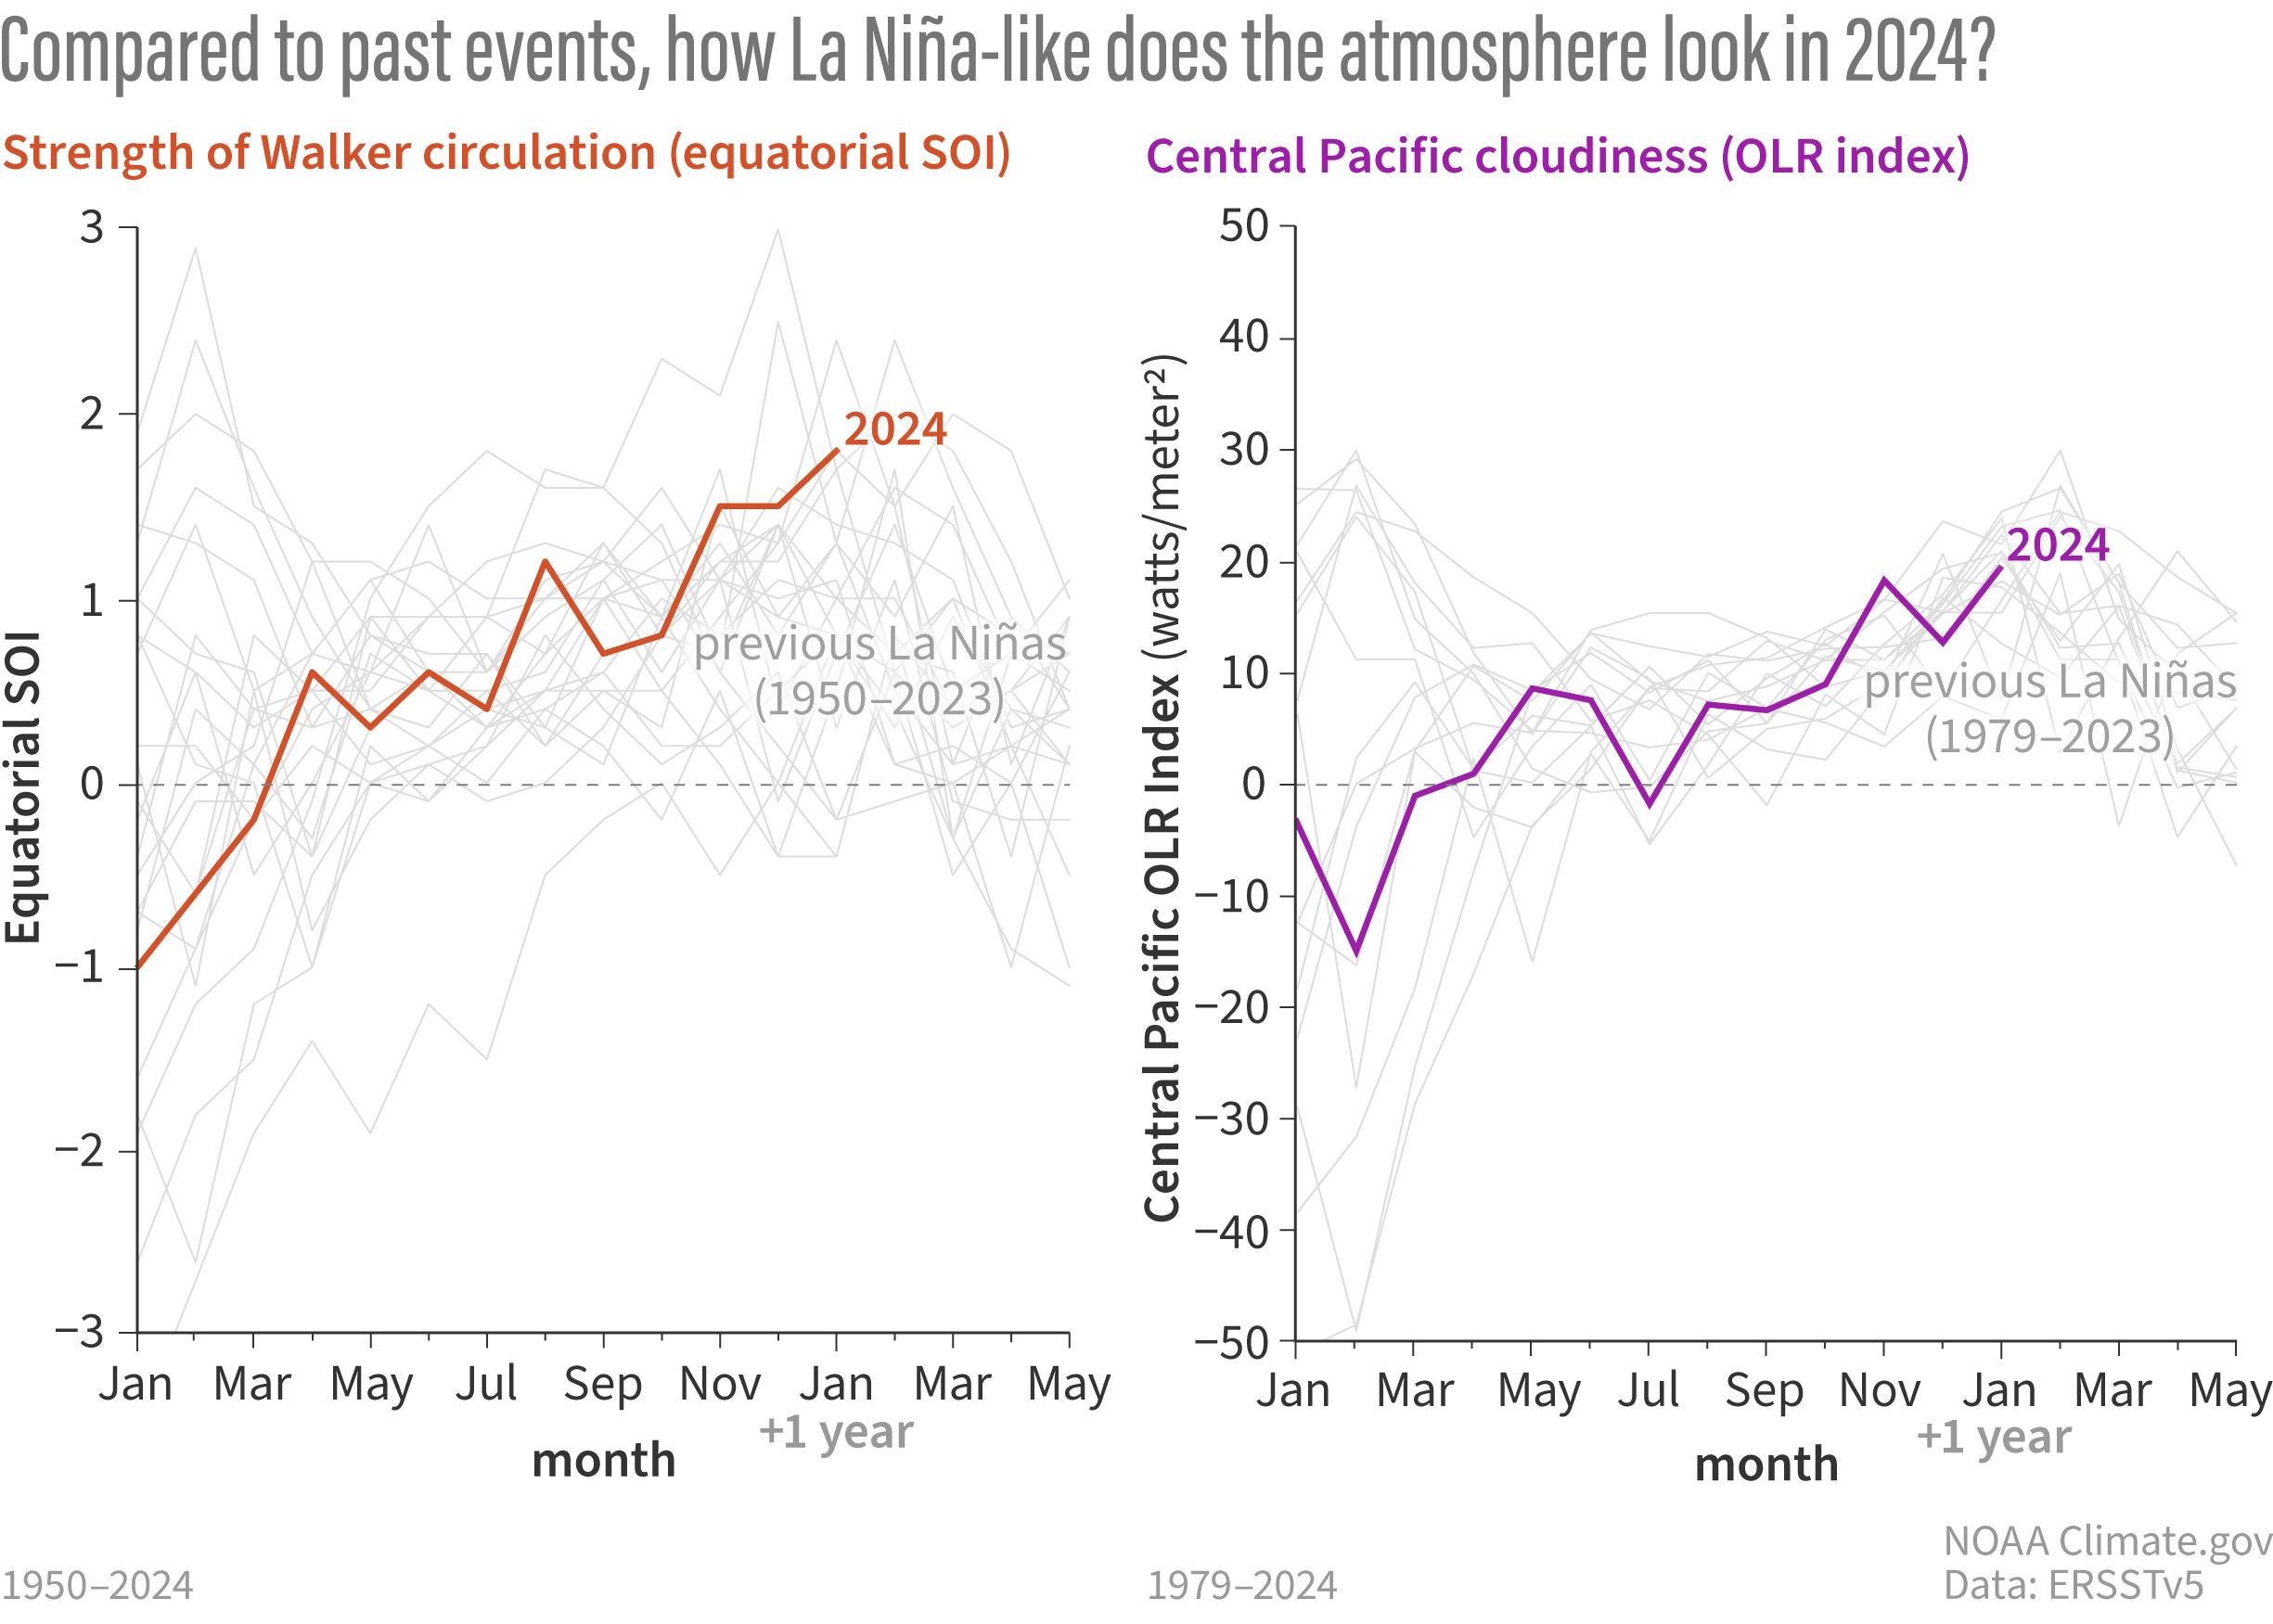
Two ways of looking at the atmospheric conditions in the tropical Pacific: the Equatorial Southern Oscillation (left) and cloudiness in the central Pacific (right). The colored lines show 2024–25, while the gray lines are every La Niña on record since 1979. Both measurements provide evidence that the Walker circulation is stronger than average, a La Niña atmospheric signature, and among the strongest on the record. Climate.gov graph, based on data from Michelle L’Heureux.