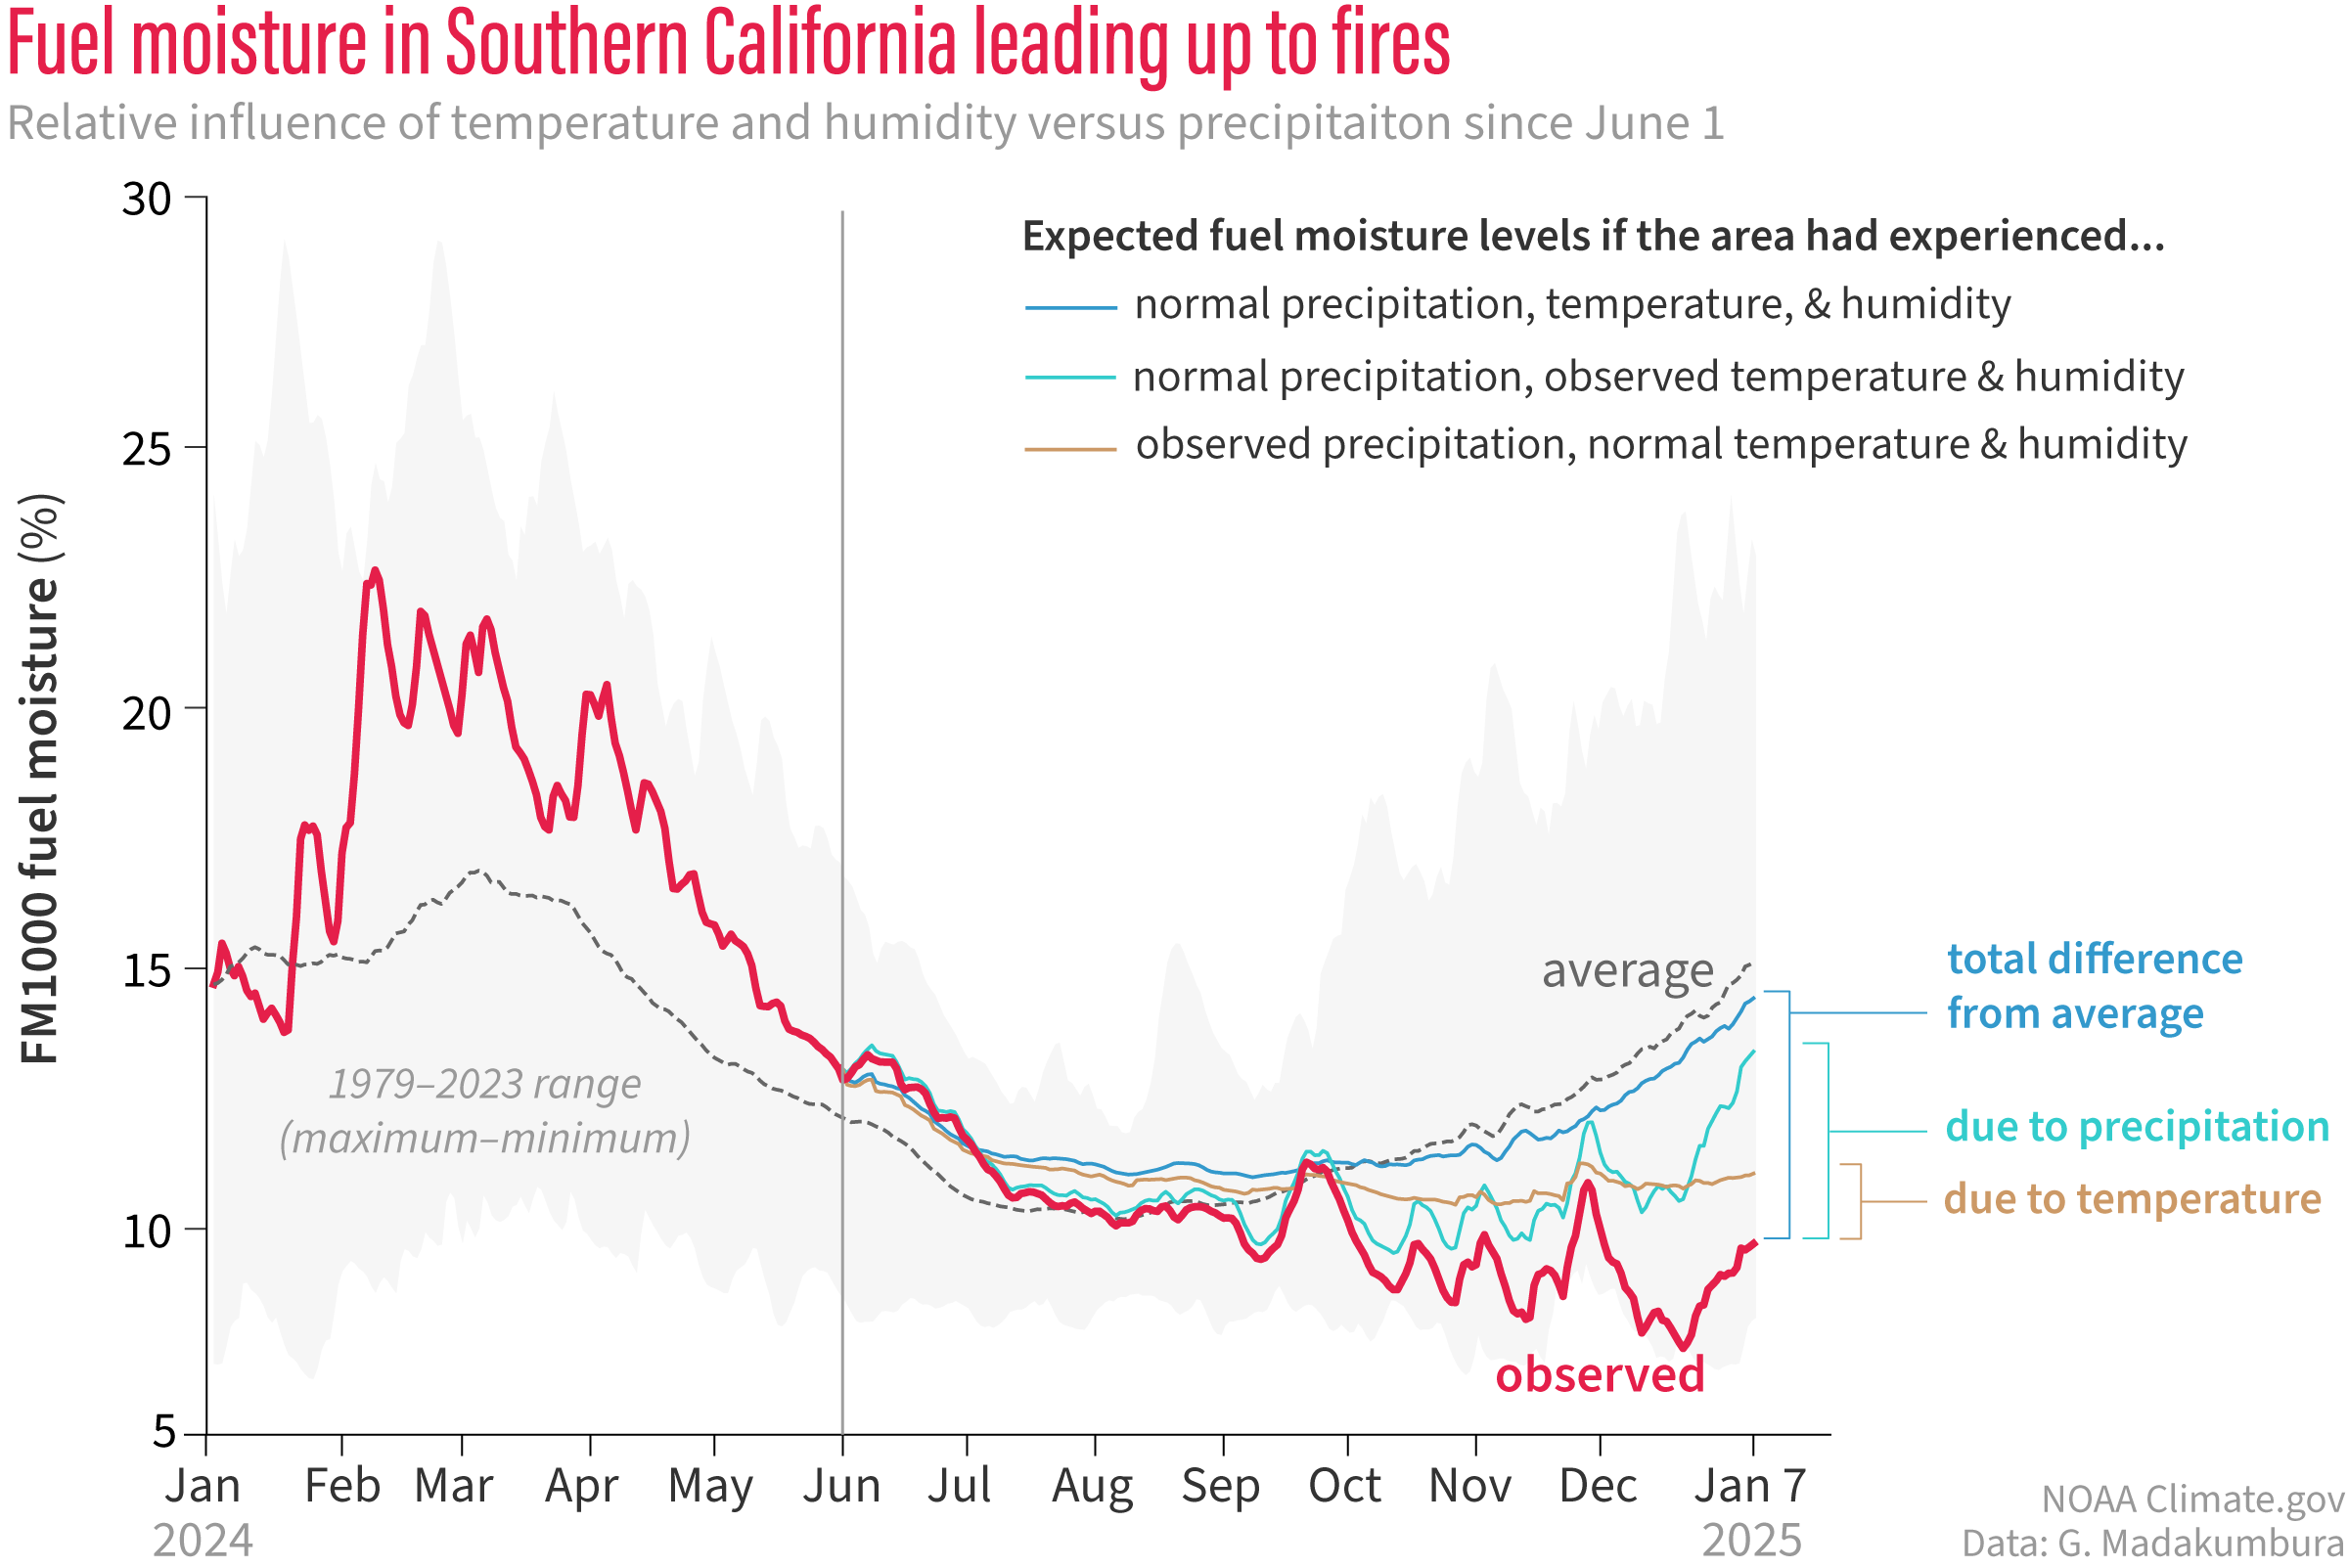
Image caption
Observed fuel moisture in the area around Los Angeles from January 1, 2024, through Jan 7, 2025. Fuel moisture was above average in the first half of 2024, but dropped well below average in fall 2025. Additional lines show that fuel moisture would have been only slightly below average if temperature, humidity, and precipitation had been near normal after June 1 (blue line). THe turquoise line shows estimated fuel moisture if the observed high temperatures and low humidity had been accompanied by normal precipitation. The brown line shows estimated fuel moisture if the observed low precipitation had been accompanied by normal temperature and humidity. NOAA Climate.gov graph, adapted from original by Gavin Madakumbura.