
Image caption
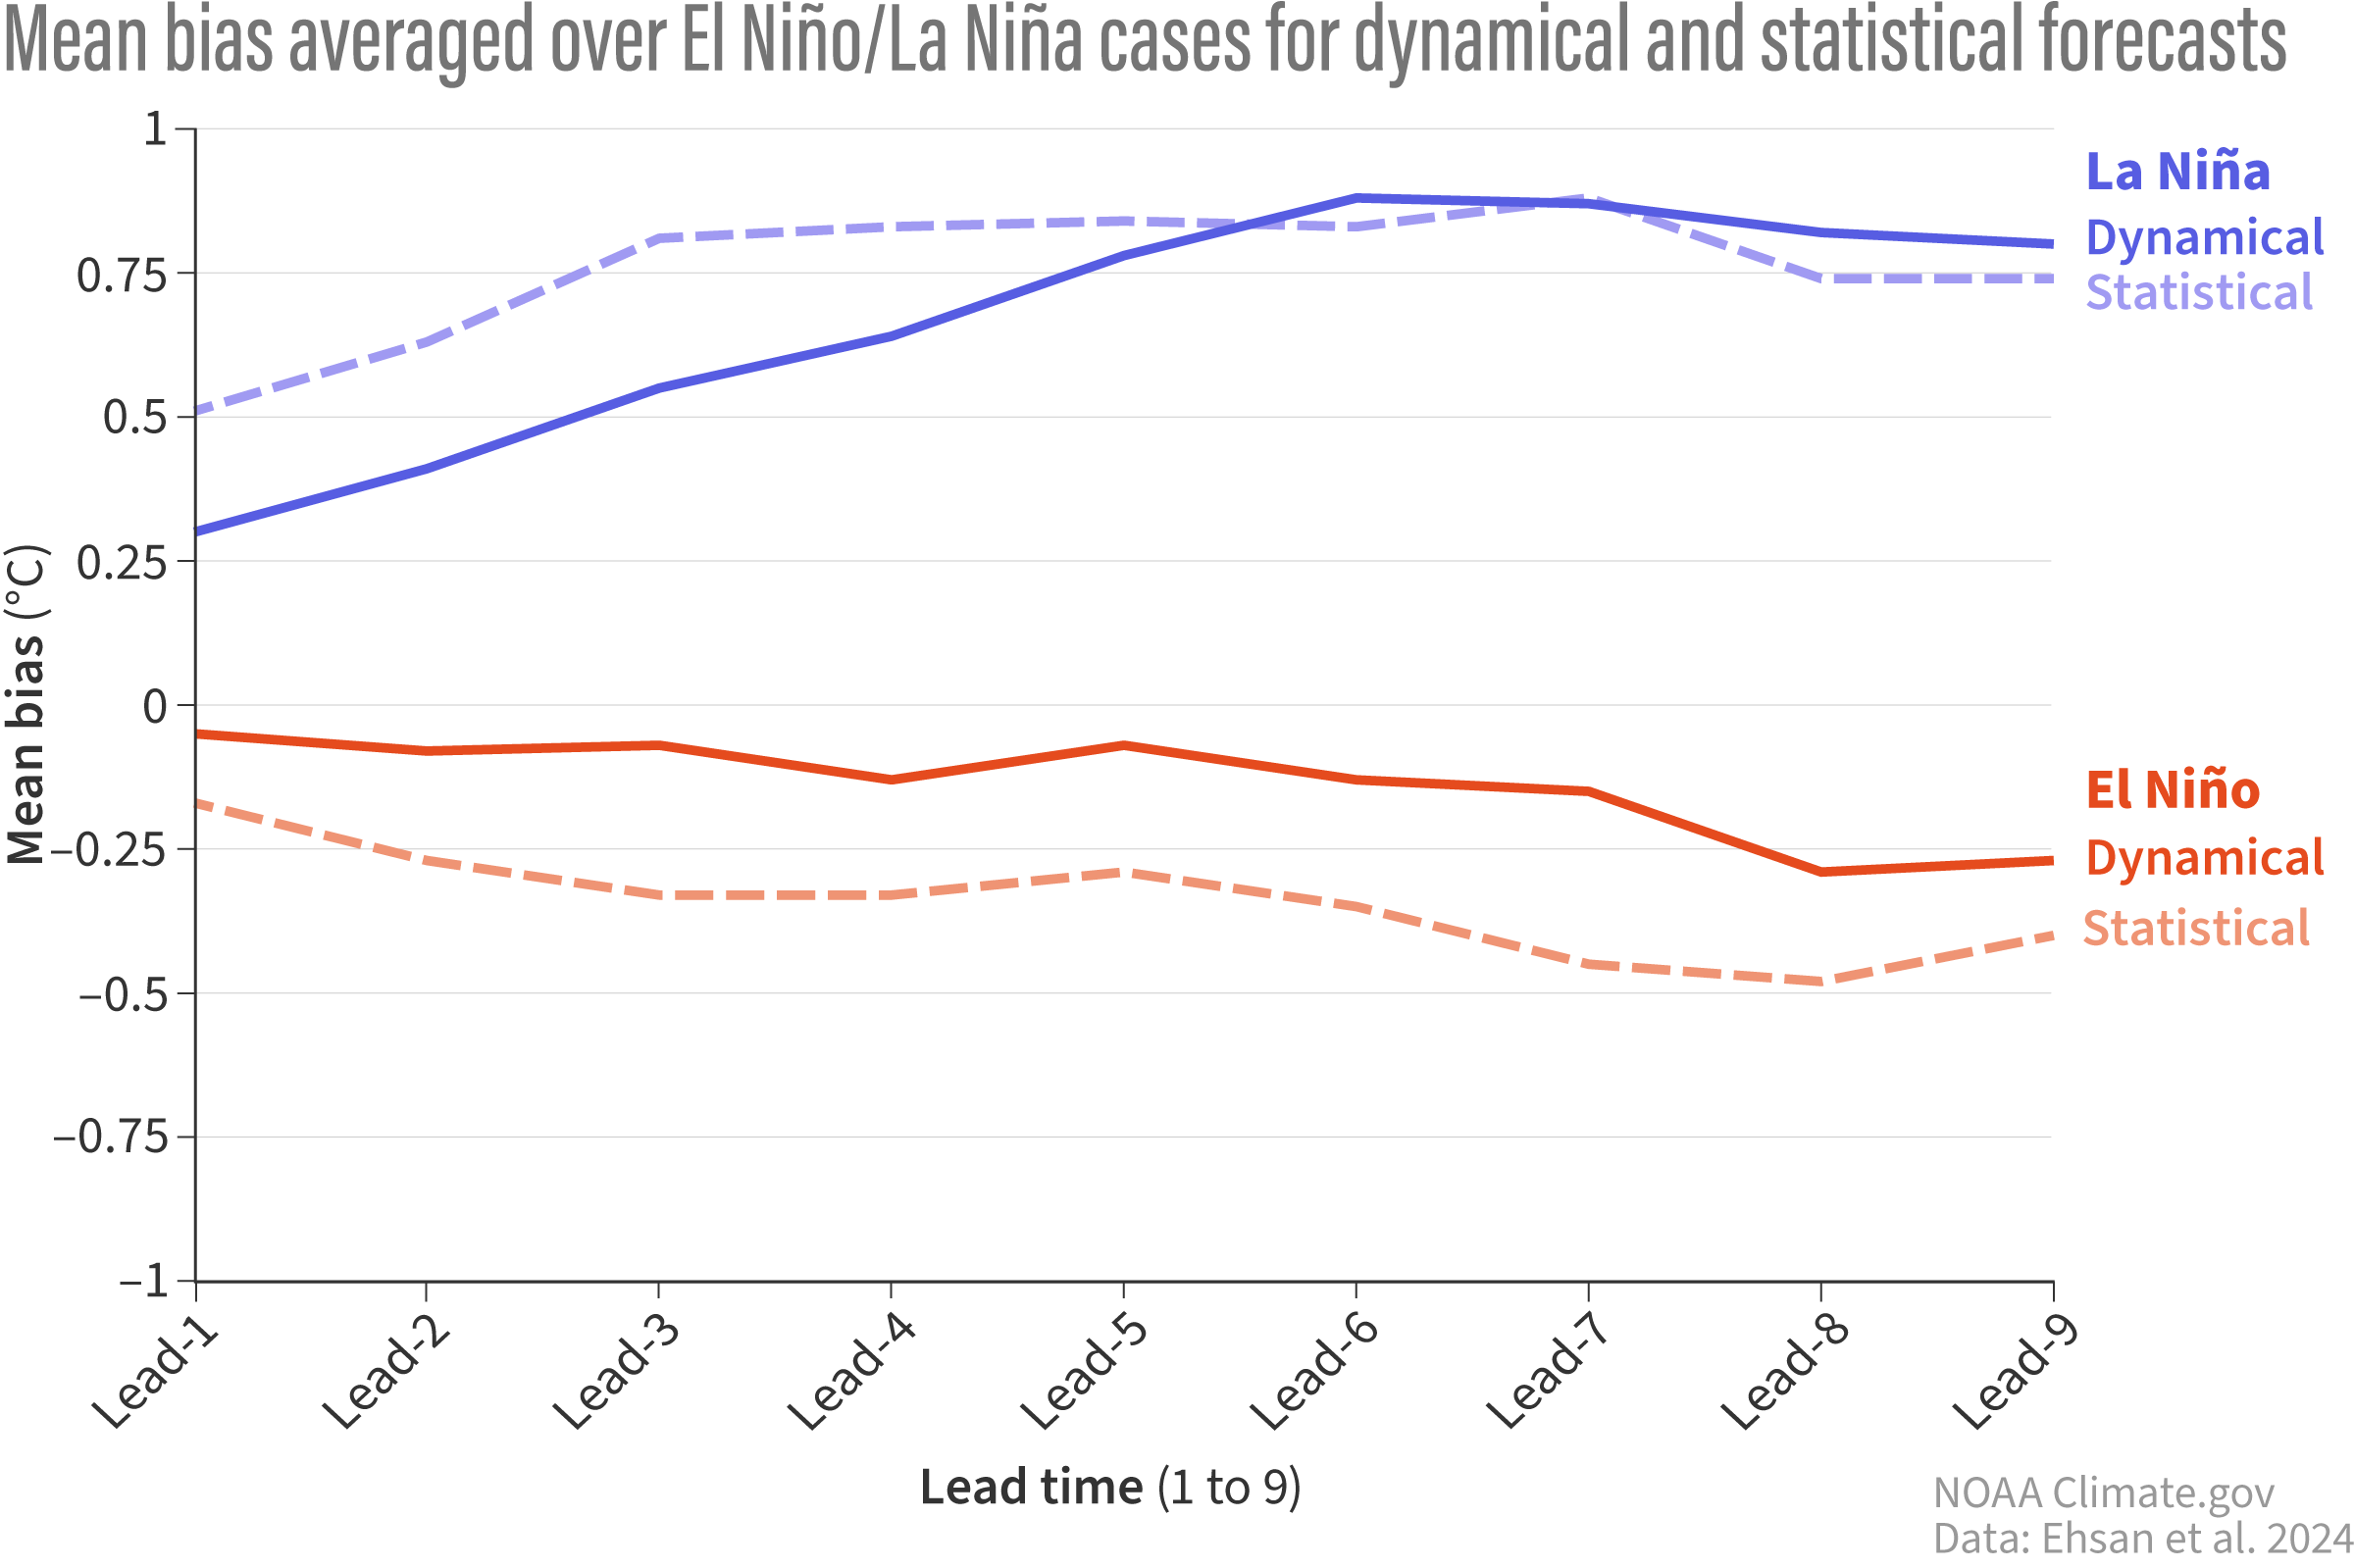
The mean bias of climate model forecasts averaged over El Nino (red) and La Nina (blue) events for each lead time, which refers to the three-month period forecasted. Solid lines are dynamical model forecasts, and dotted lines are statistical models. Overall, models have less bias when predicting El Nino than La Nina. And dynamical models have less bias in general compared to statistical models. Climate.gov image adapted from Ehsan et al., 2024.