
Image caption
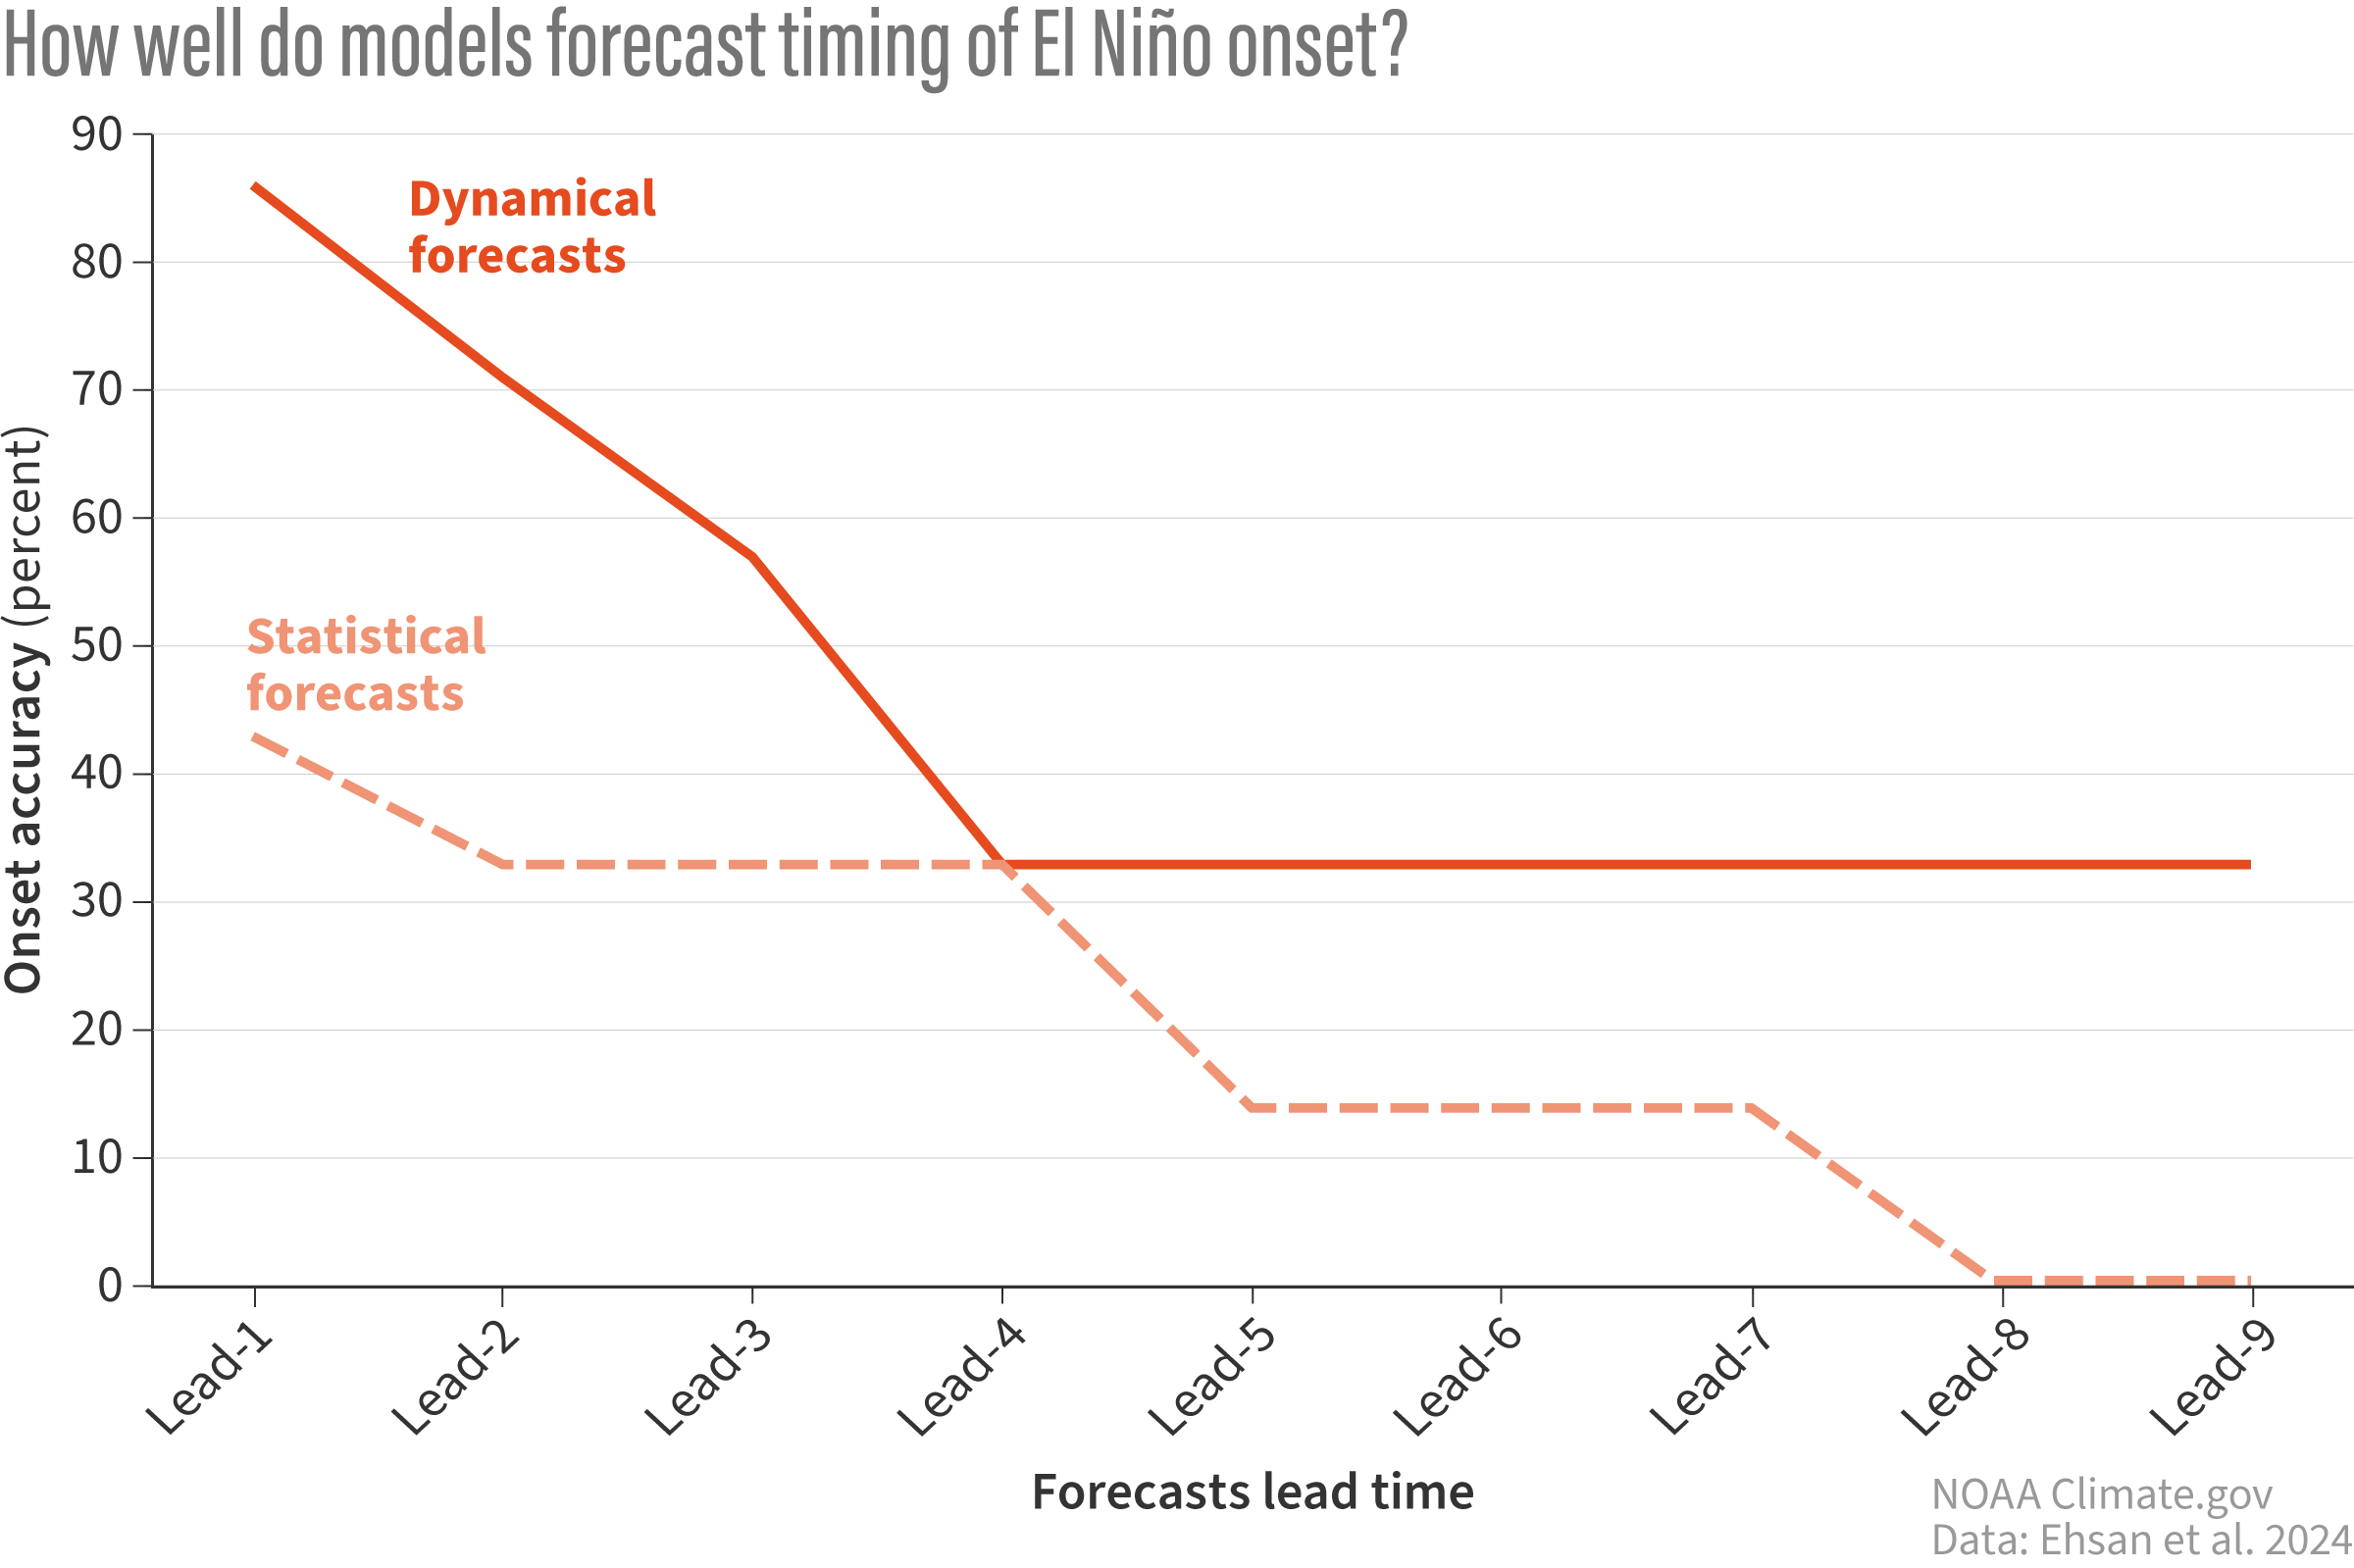
How often (percent) real-time climate model forecasts correctly predict the onset of El Nino (3-month average Nino3.4 values greater than or equal to 0.5C) at increasingly far-off lead times. Solid lines are the multi-model mean of dynamical model forecasts. Dotted lines are the multi-model mean of statistical model forecasts. Dynamical models have excellent accuracy at predicting the onset through the first three seasonal lead times before dropping to 30-40% accuracy from lead-4 onwards. Statistical models show less accuracy overall. Climate.gov image adapted from Ehsan et al., 2024.