
Image caption
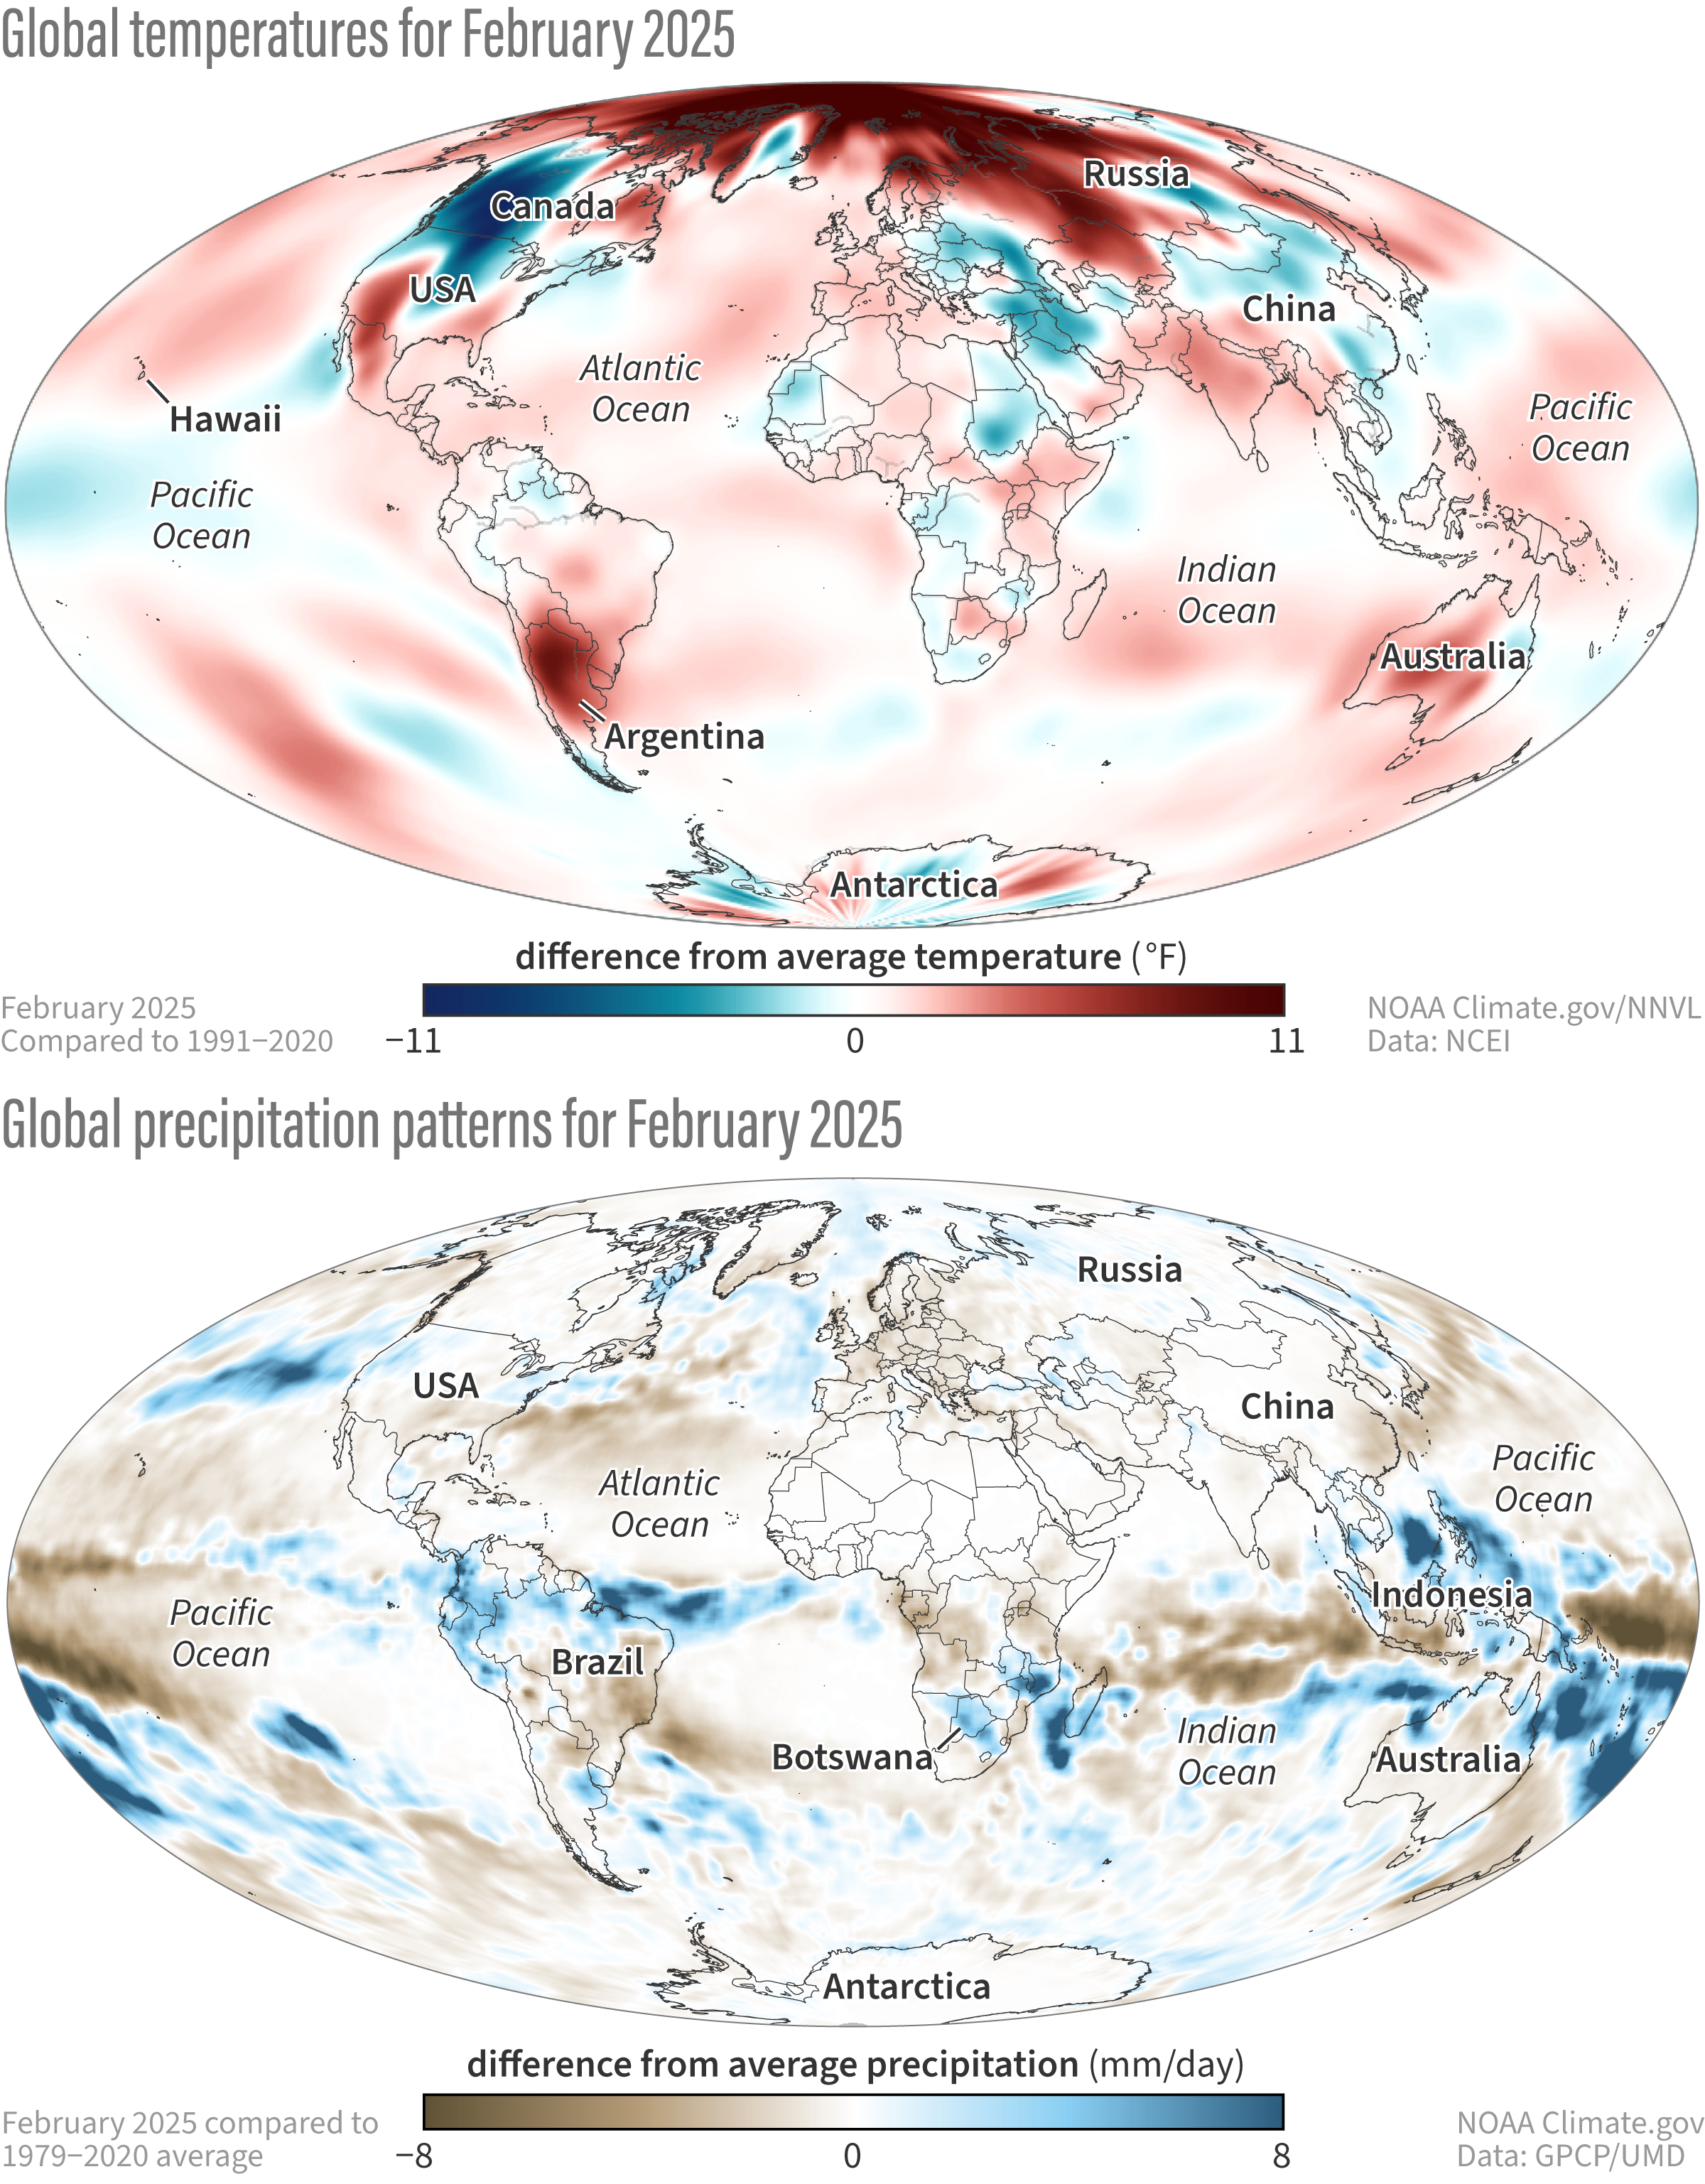
(top) Global temperature in February 2025 compared to the 1991–2020 average. Places where temperatures were above average are red; places where it was below average are blue. (bottom) Precipitation in February 2025 compared to the 1979–2020 average. Places where precipitation was above average are blue; places where it was below average are brown. NOAA Climate.gov maps based on data from NOAA National Centers for Environmental Information (temperature) and the Global Precipitation Climatology Project (precipitation).