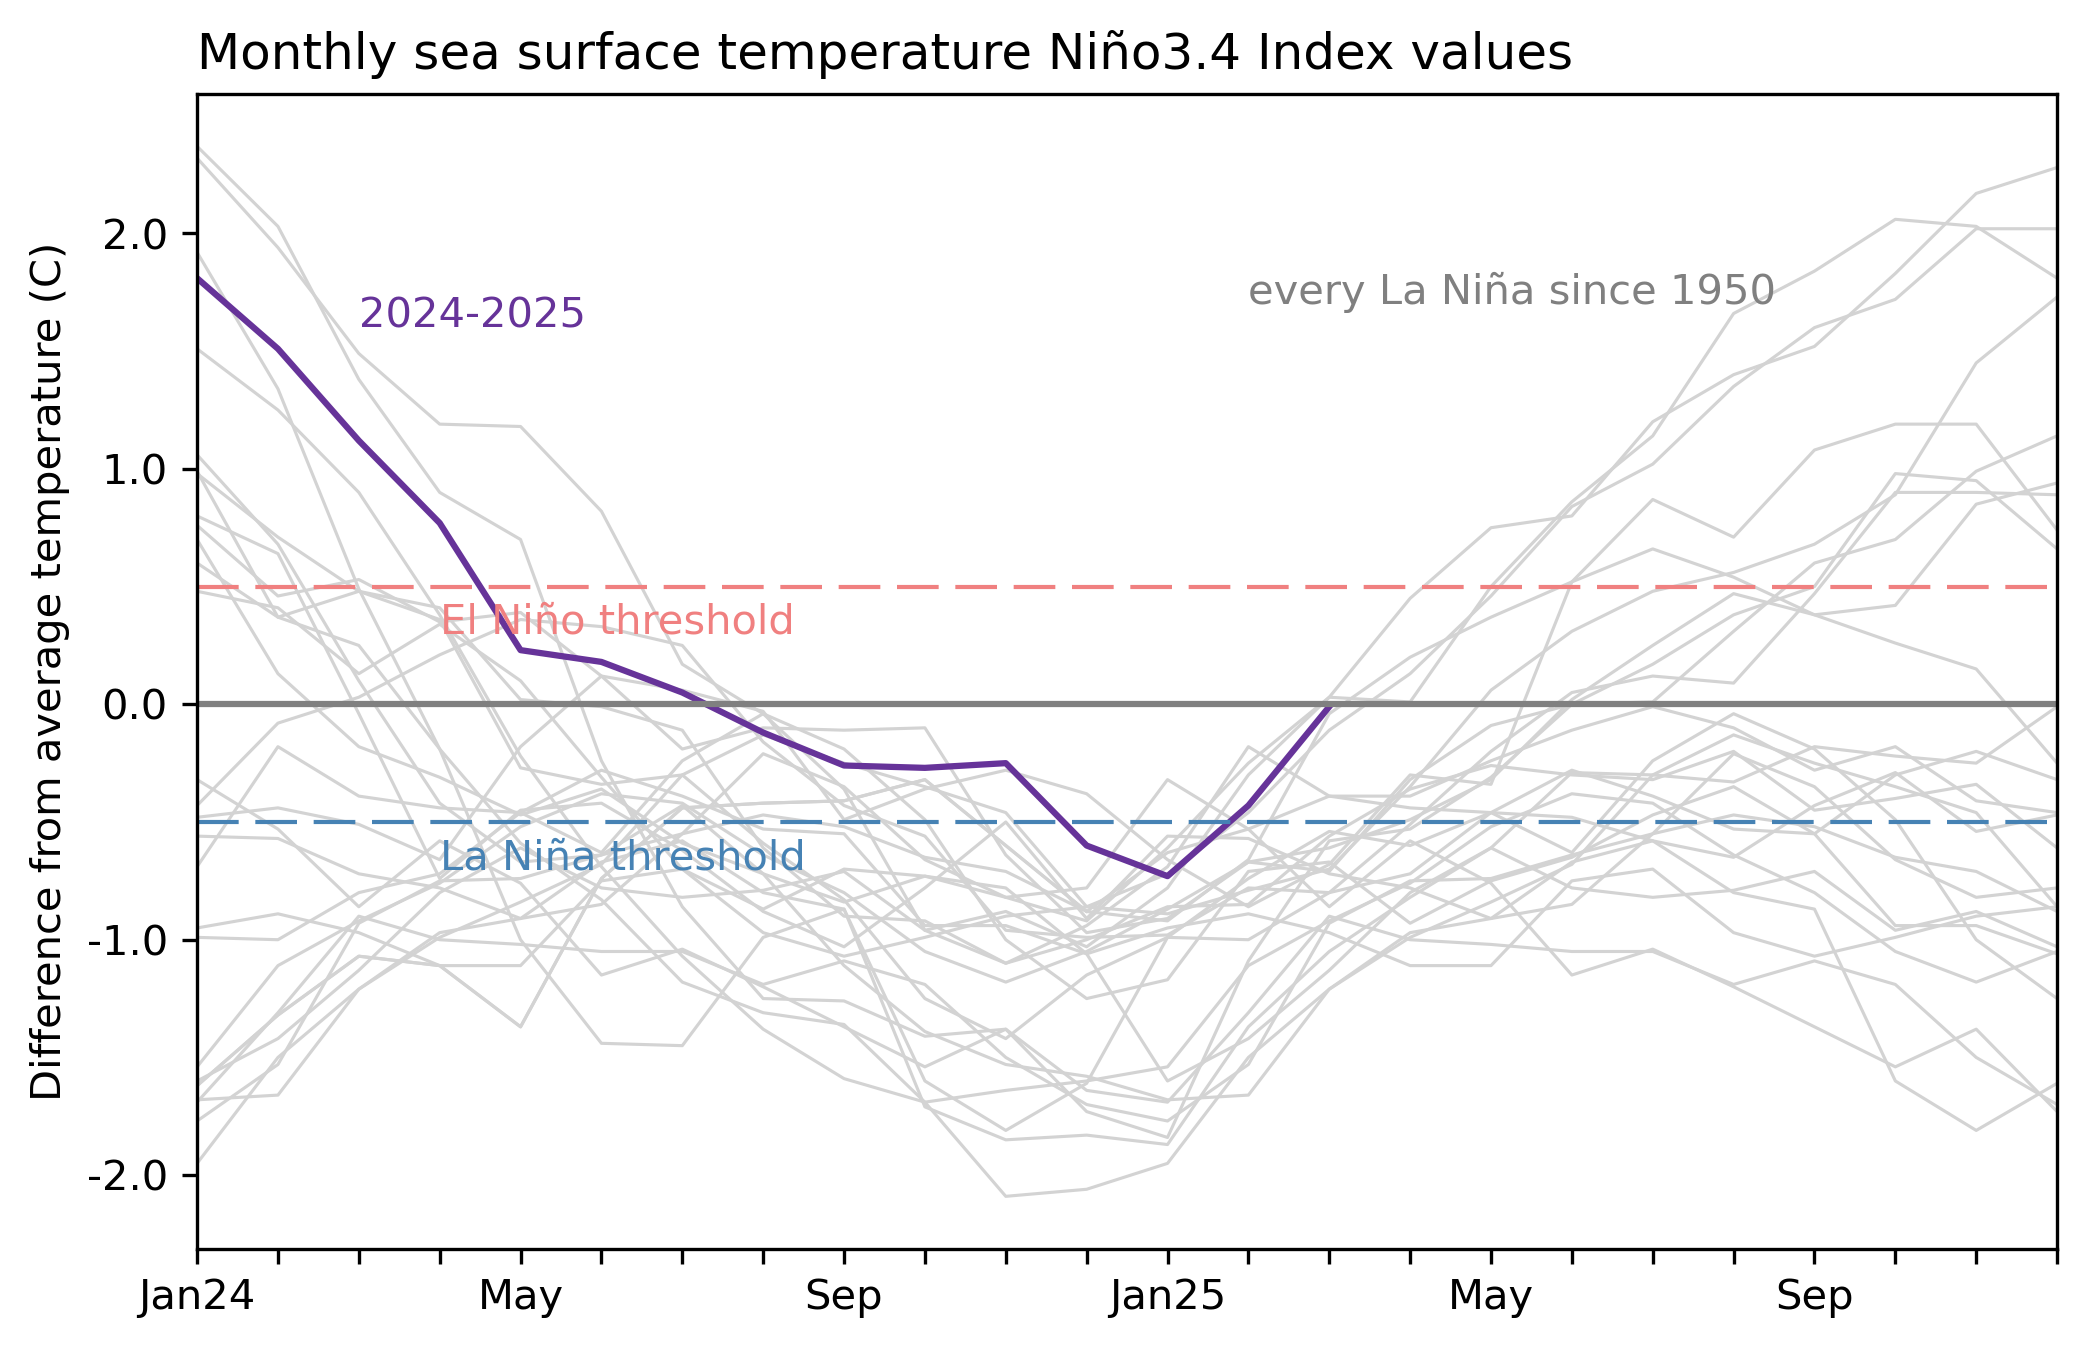
Image caption
2-year history of sea surface temperatures in the Niño-3.4 region of the tropical Pacific for all La Nina events since 1950 (gray lines) and the recent (2024-25) event (purple line). After dipping into La Niña for a few months, the Niño-3.4 index returned to near average in March 2025. Graph by Emily Becker, based on monthly Niño-3.4 index data from CPC using ERSSTv5.