
Image caption
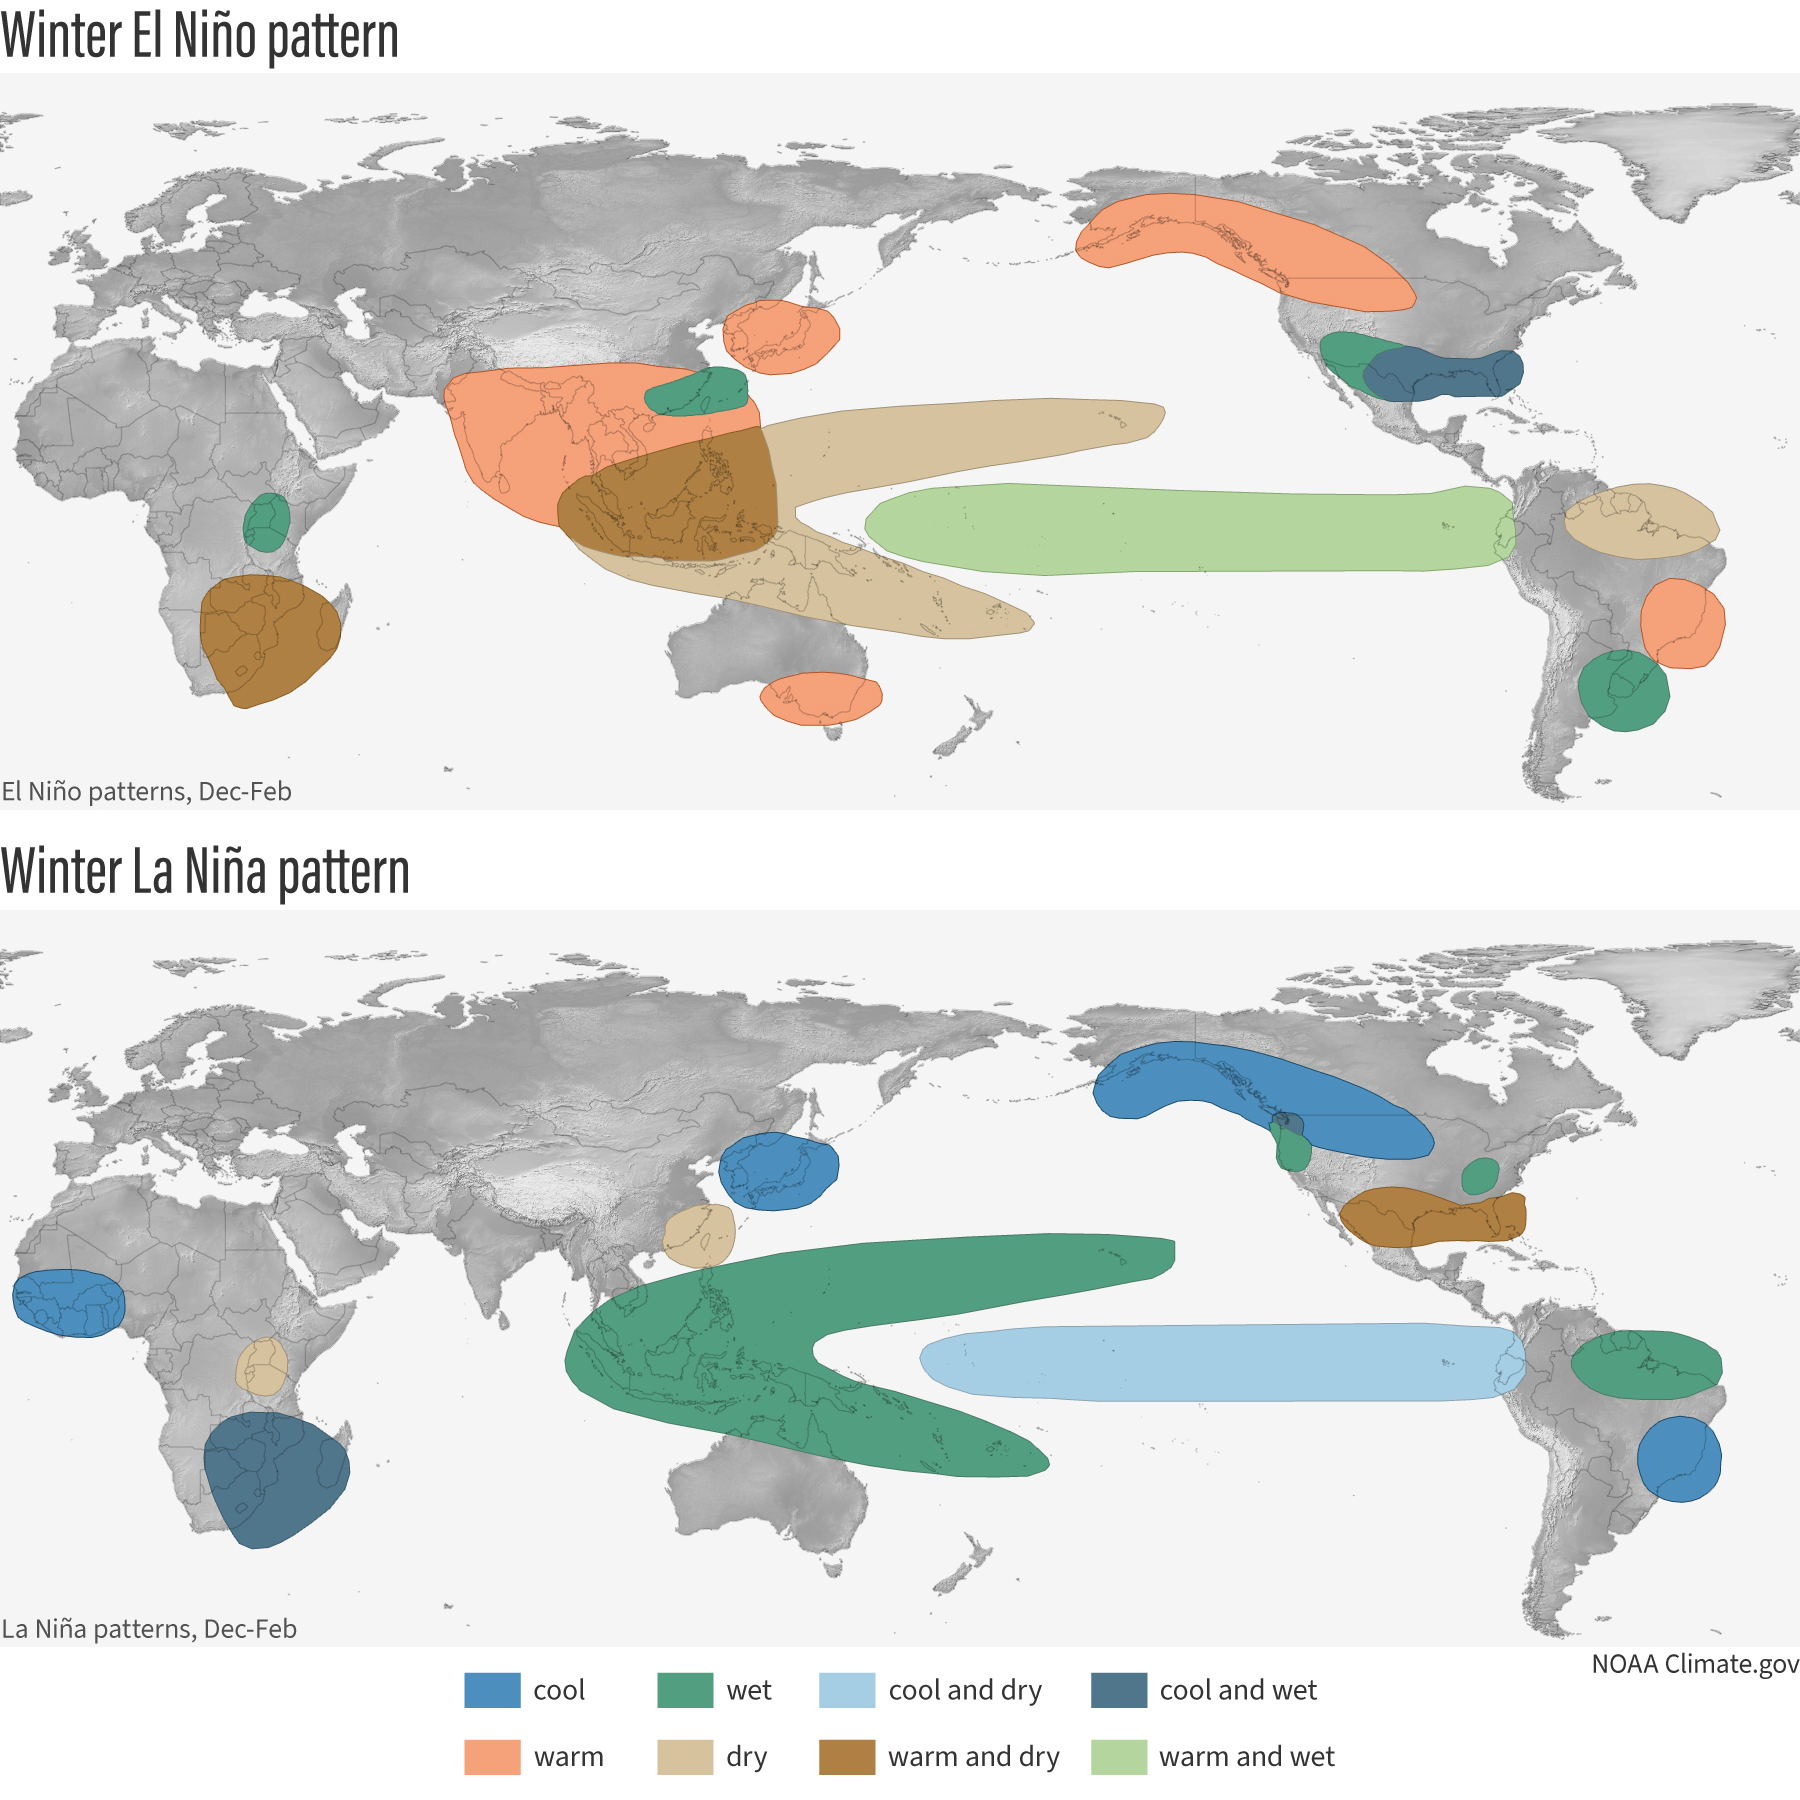
Temperature and precipitation patterns that are typical of El Niño (top) and La Niña (bottom) during Northern Hemisphere winters (December-February). Map by NOAA Climate.gov, based on originals from the Climate Prediction Center.
Temperature and precipitation patterns that are typical of El Niño (top) and La Niña (bottom) during Northern Hemisphere winters (December-February). Map by NOAA Climate.gov, based on originals from the Climate Prediction Center.