
Image caption
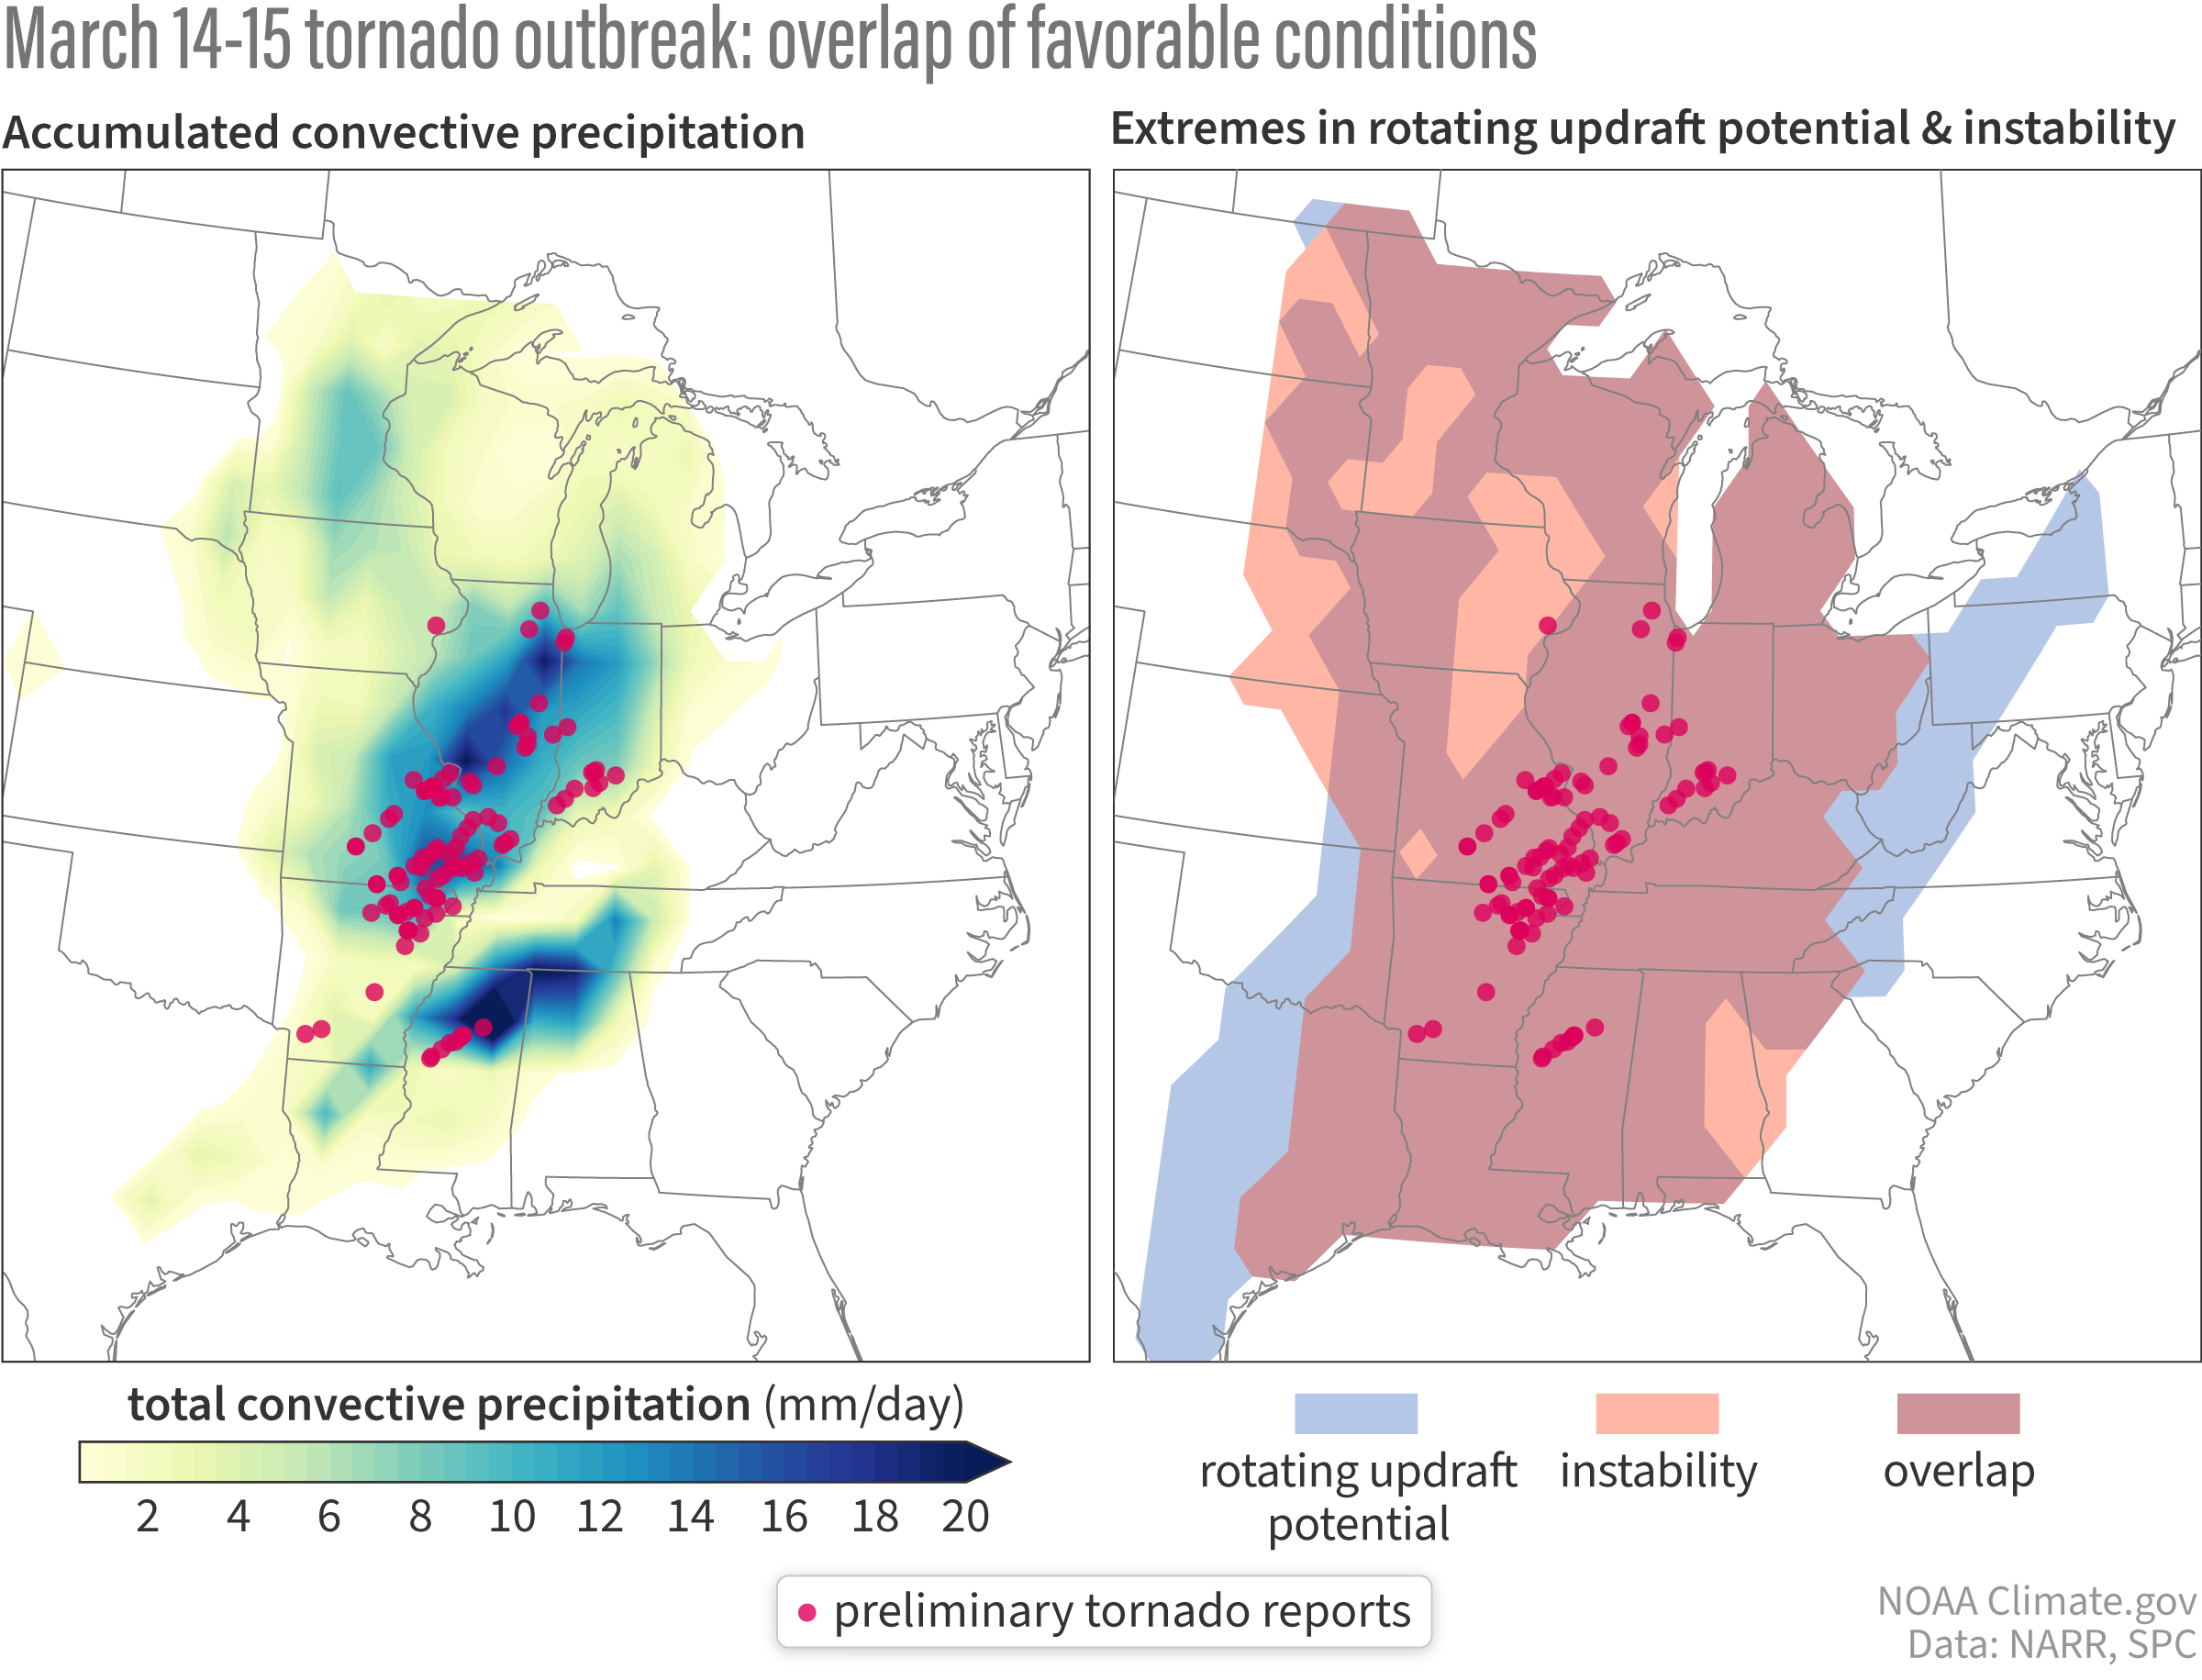
Tornado activity (red dots) during the March 14-15, 2025, outbreak was concentrated in areas where heavy convective rainfall (left map, darkest blue areas) overlapped with the areas of extreme atmospheric instability (right map, orange shading) and wind shear/rotation potential (right map, blue shading). Image by Kelsey Malloy.