
Image caption
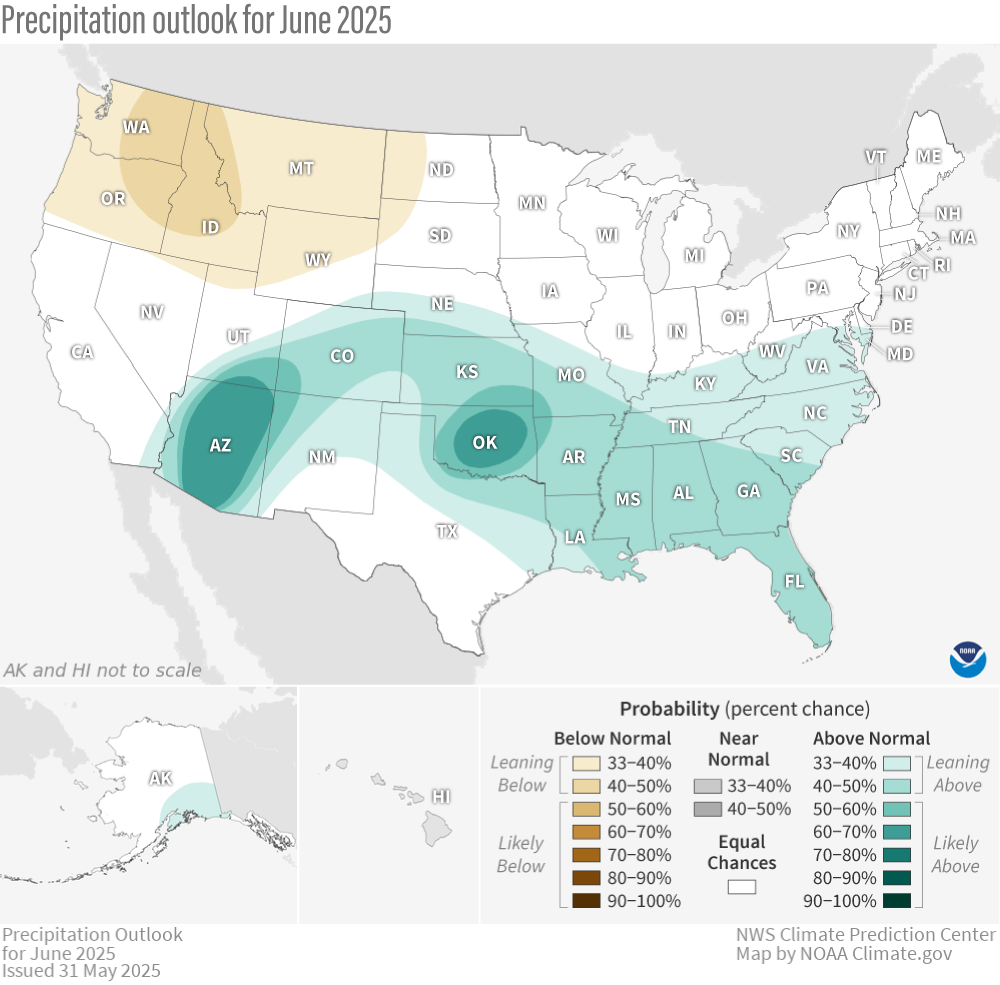
The precipitation outlook for June 2025, showing where the average precipitation (rain and snow) is favored to be much higher than average (greens) or much lower than average (browns). Darker colors mean higher chances, not more extreme precipitation departures. White areas mean that there are equal chances for a wet, dry, or near-average June. Much higher or much lower than average means "in the upper or lower third" of total June precipitation amounts from 1991-2020. Text-only forecast for Hawaii available from NOAA Climate Prediction Center.