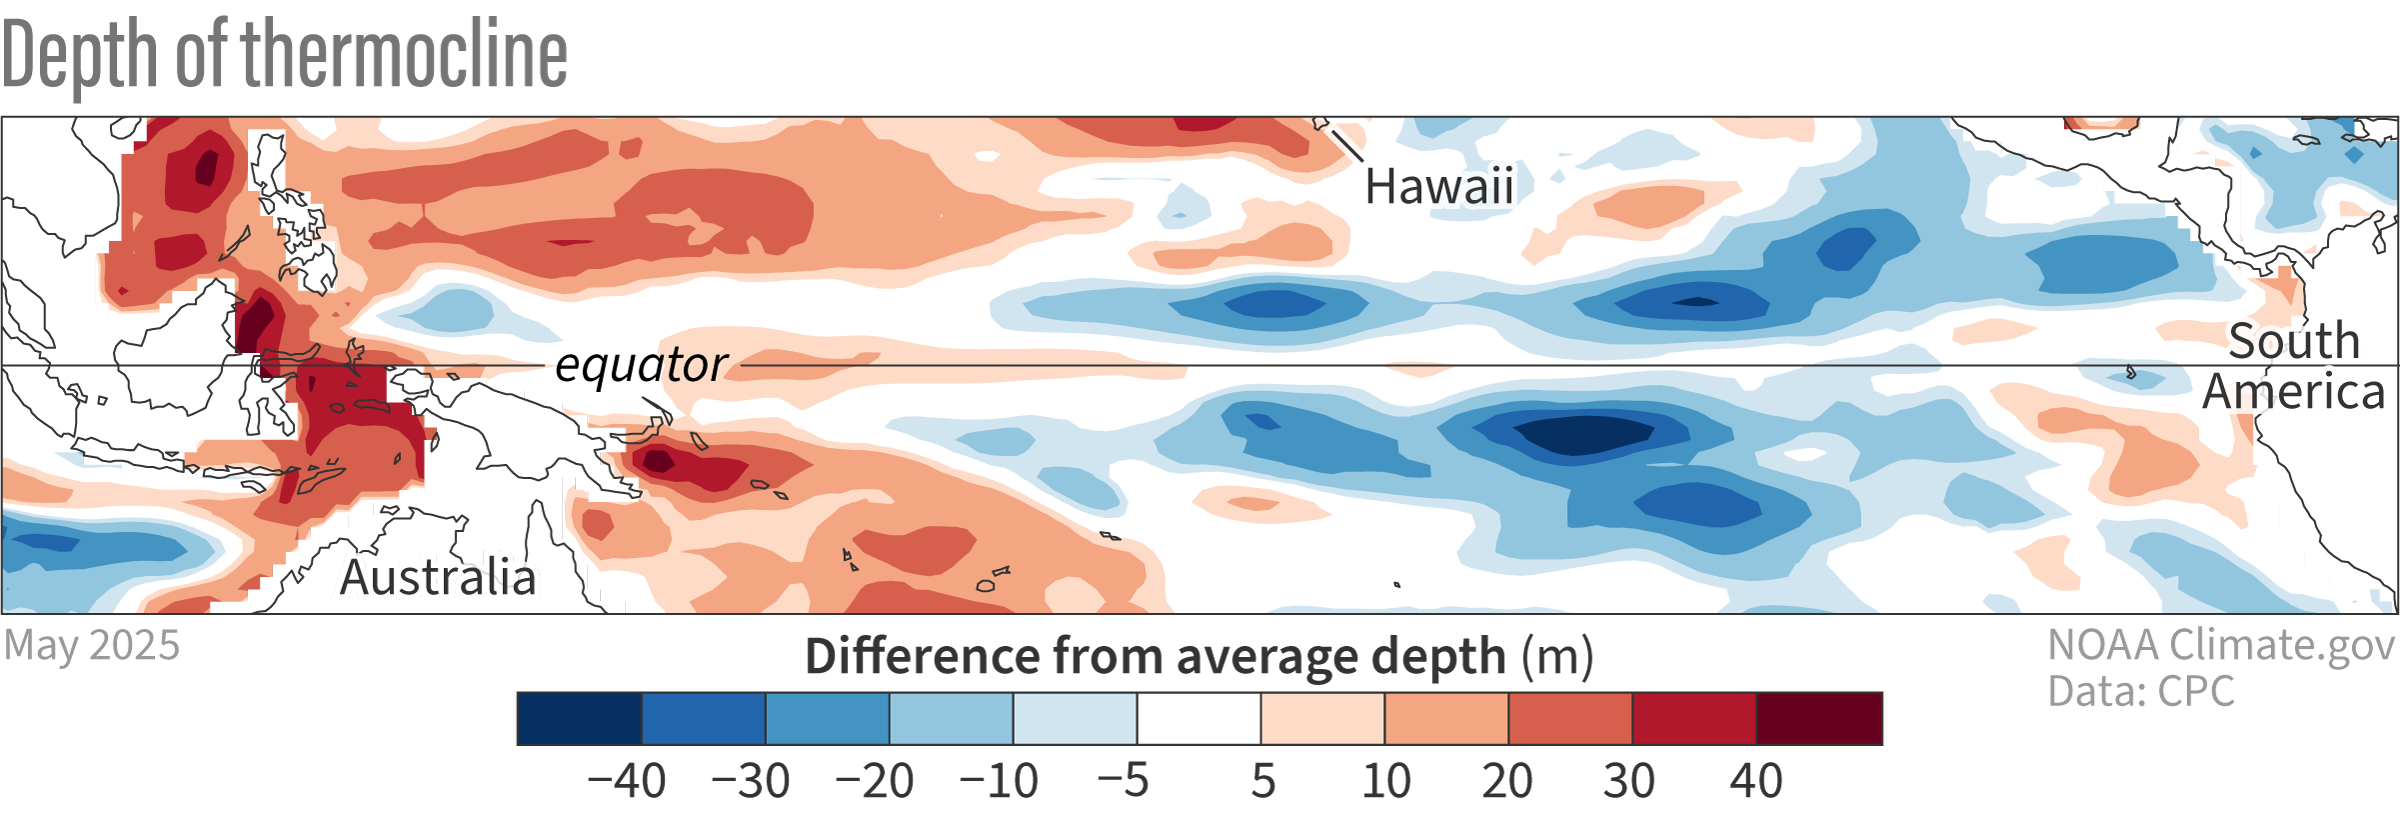
Image caption
This map shows the temperature pattern under the surface of the tropical Pacific Ocean. The colors show how much deeper (red) or shallower (blue) than average the 20-degree temperature line lies. More warm subsurface water is present where the 20-degree isotherm is deeper than average (red), while cooler water is indicated when the 20-degree line is closer to the surface (blue). There is a narrow strip of warmer subsurface along the equator in the western and central Pacific, flanked by large areas of cooler subsurface to the north and south. In the past, this pattern has preceded second-year La Niña events. Figure by climate.gov based on original from Caihong Wen.