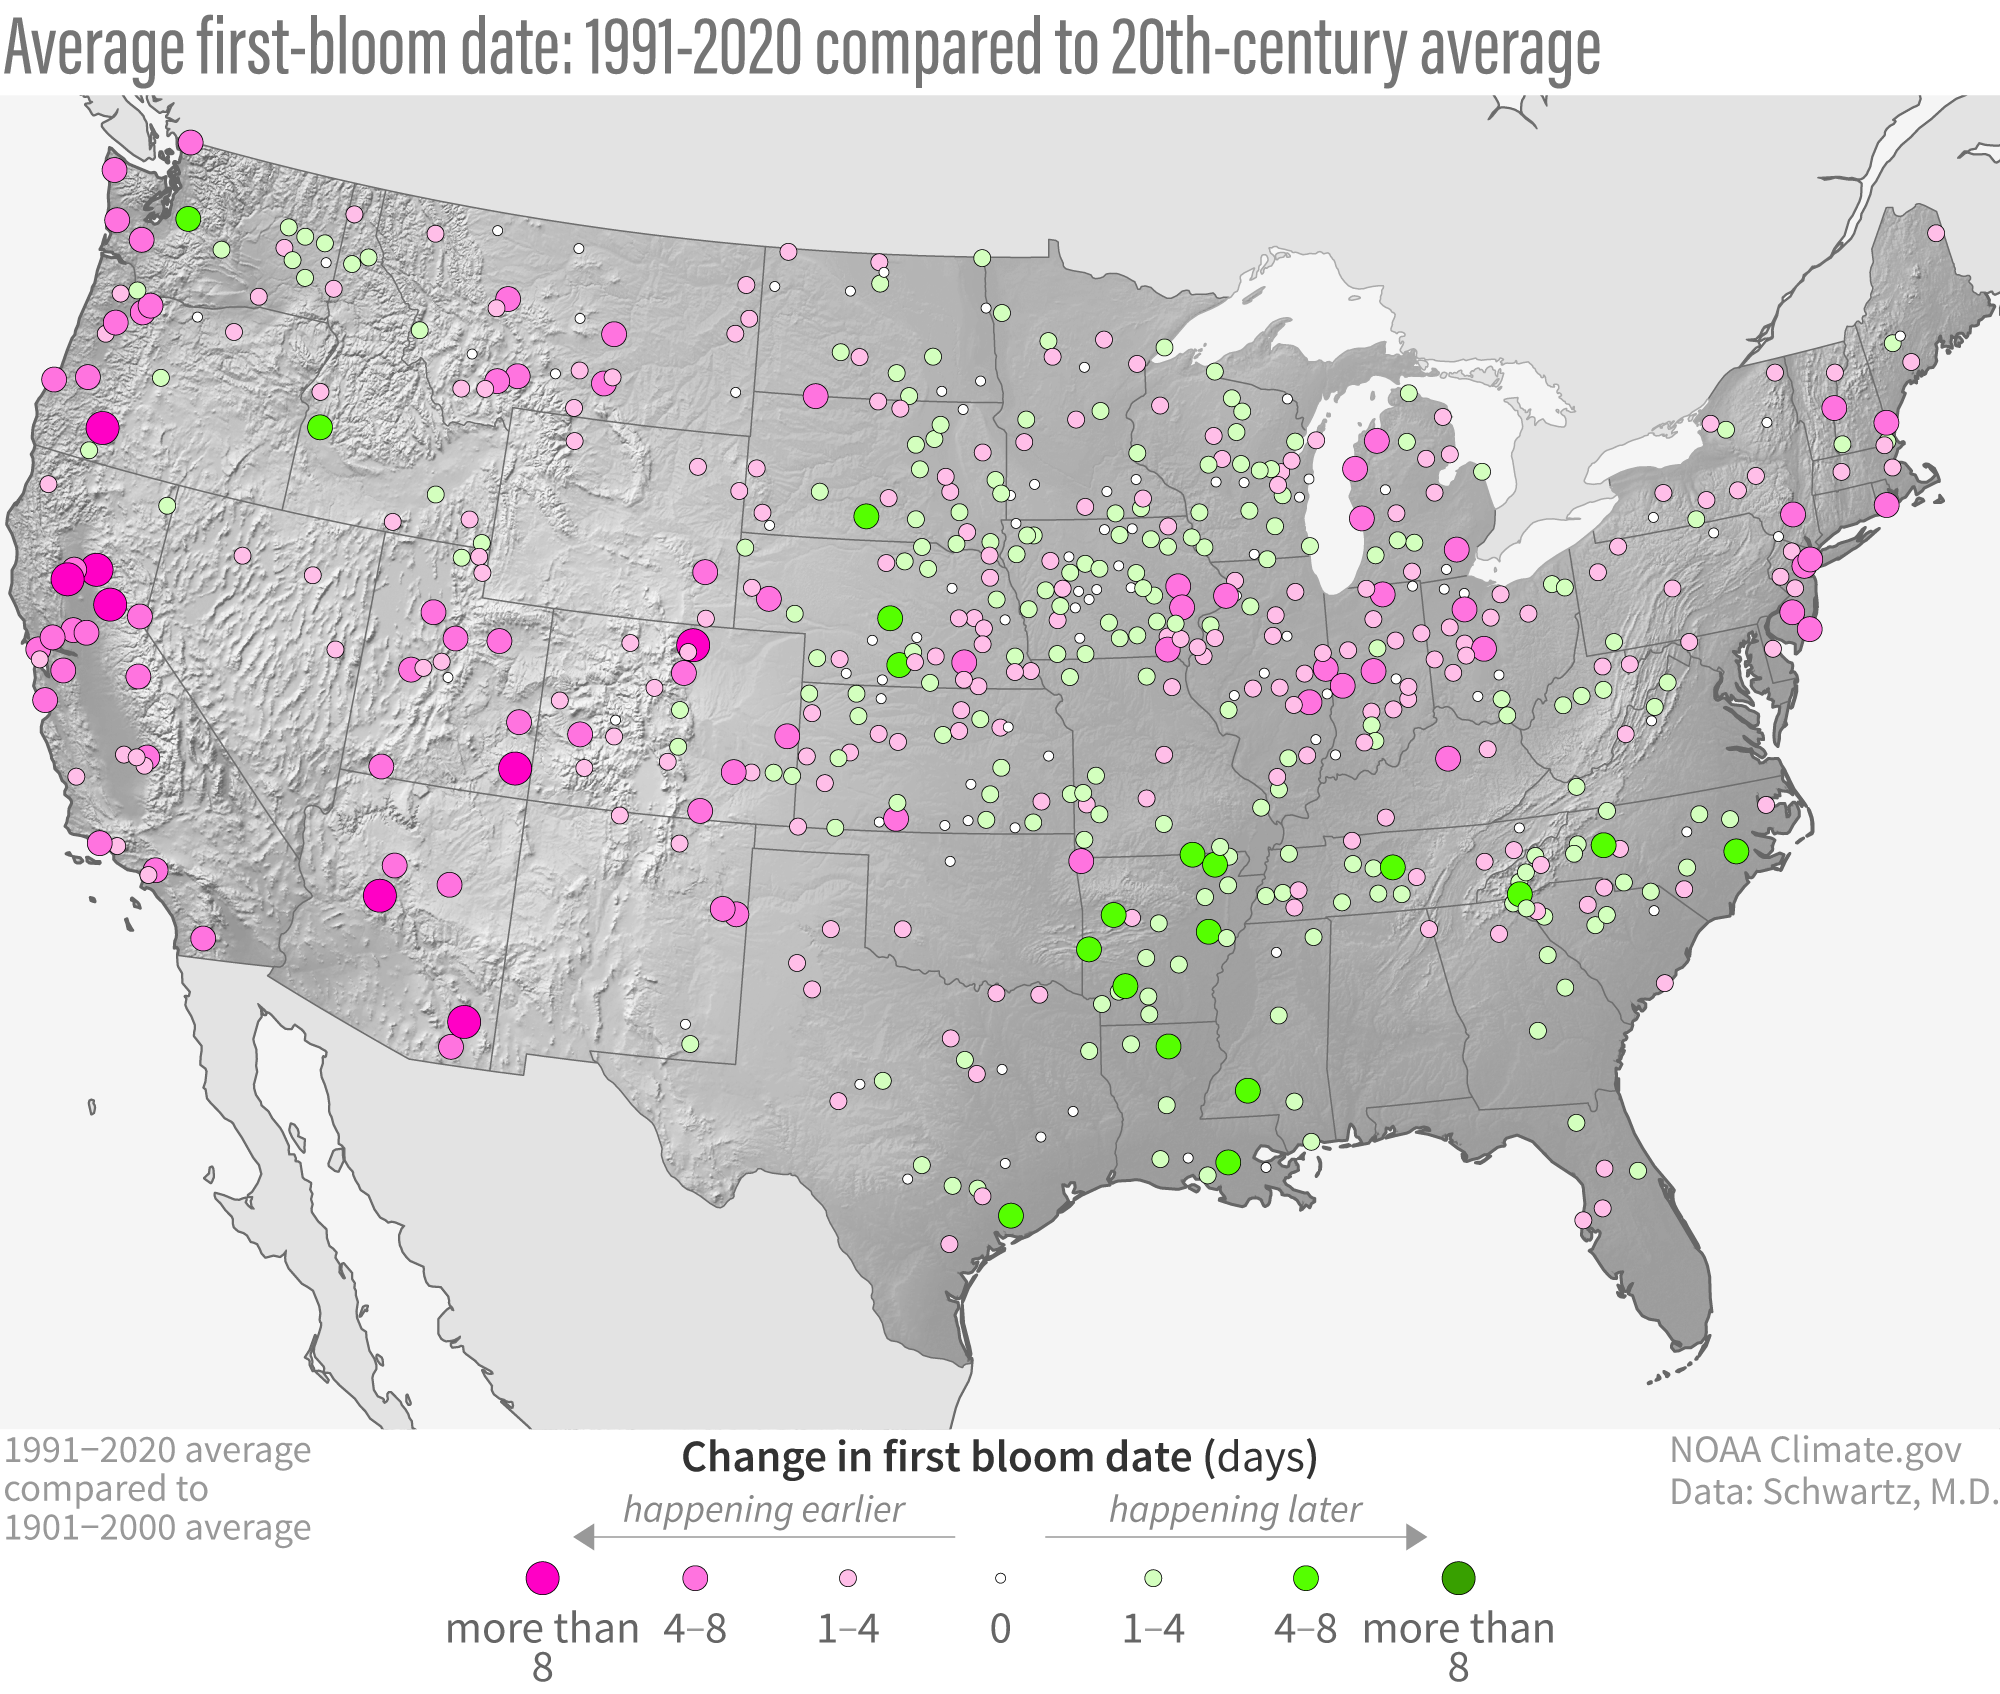
Image caption
Average first-bloom date from 1991-2020 compared to the 20th-century average (1901-2000). Pink shows places where the first bloom of lilacs and honeysuckle emerged earlier than the long-term average; green shows places where blooms were later than the long-term average. NOAA Climate.gov map, based on analysis by Mark D. Schwartz, University of Wisconsin-Milwaukee.