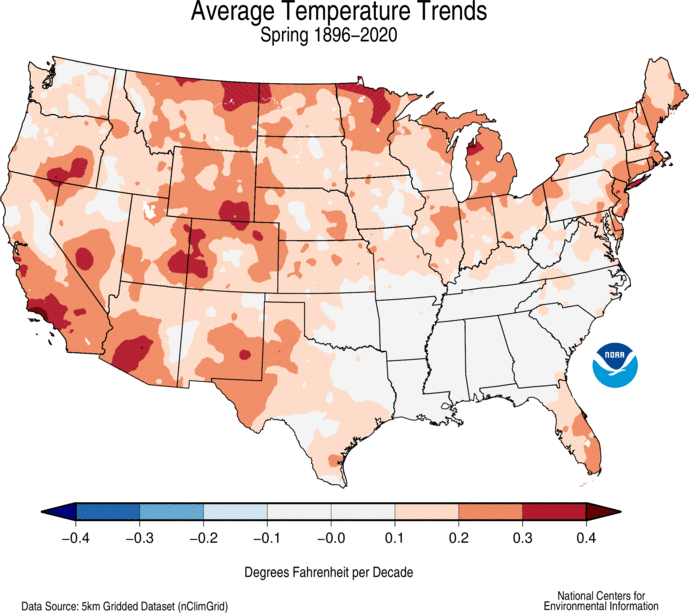
Image caption
Average temperatures trend for spring (March-May) from 1896-2020. This map shows how spring temperatures have changed across the contiguous United States. Orange to red show where temperatures have warmed, and gray shows where temperature changes have been close to zero. Map from NOAA’s National Centers for Environmental Information.