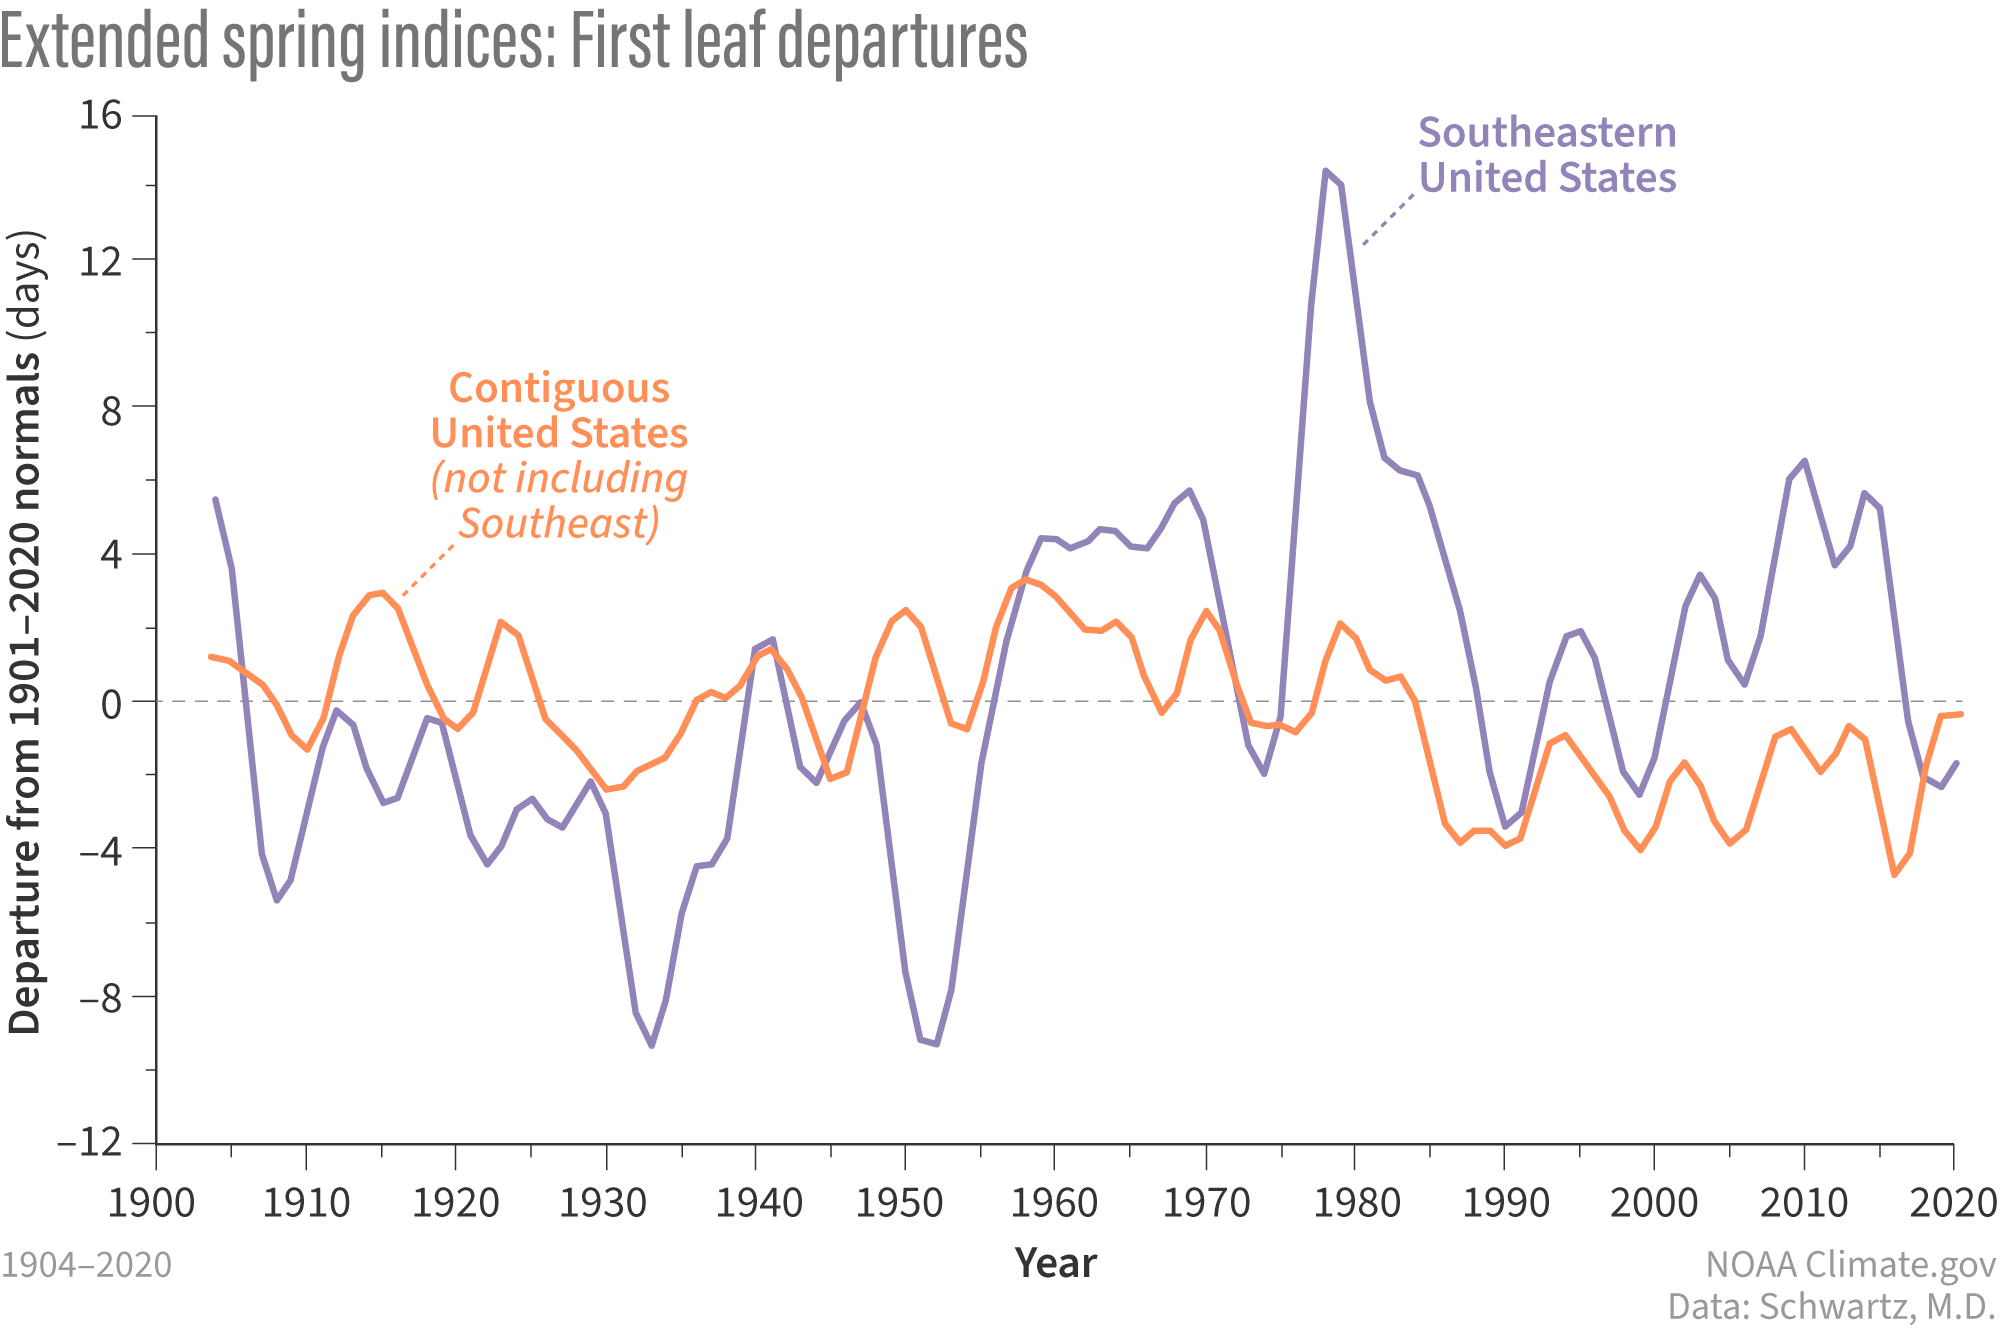
Image caption
Smoothed Spring Leaf Index departures from the 20th-century average for the Southeastern United States in purple and the rest of the lower-48 states in orange from 1904–2020. Graph by NOAA Climate.gov, based on analysis by Mark D. Schwartz, University of Wisconsin-Milwaukee