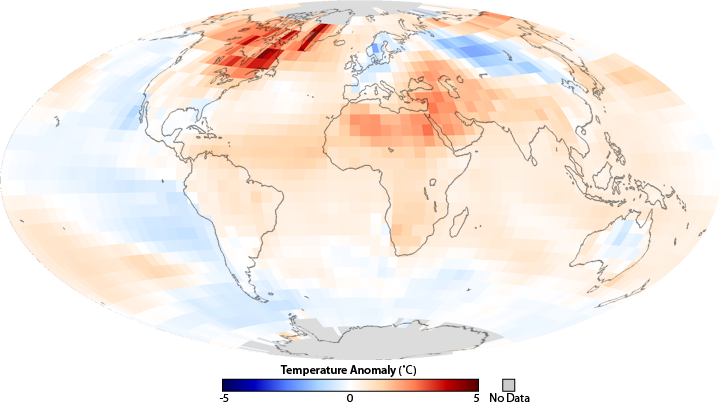
File name: ghcn_temp_comp-01-01.png Original Resolution (pixels): 720 × 415 File Size: 155 KB (MIME Type: image/png) Date Published: February 8, 2013 View image full size Download file Image caption Map of global average temperatures in 2010 compared to the 1971-2000 average.