
Image caption
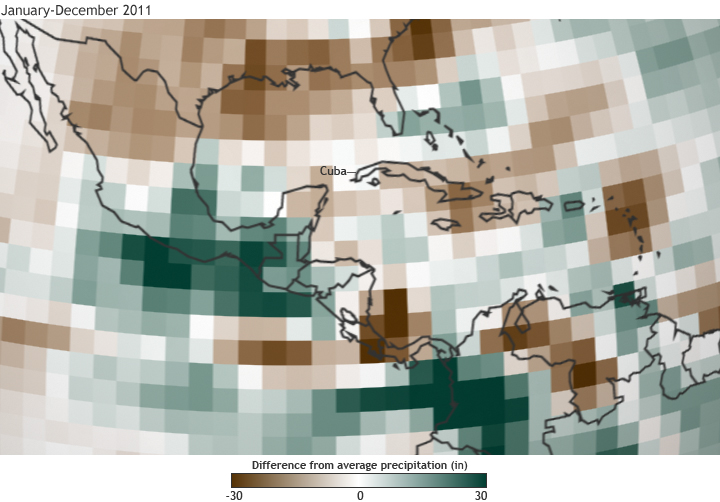
The map shows the difference from average annual precipitation across Central America and the Caribbean region for 2011. Shades of brown indicate areas that received up to 30 inches less than average precipitation while green indicates up to 30 inches more than average.