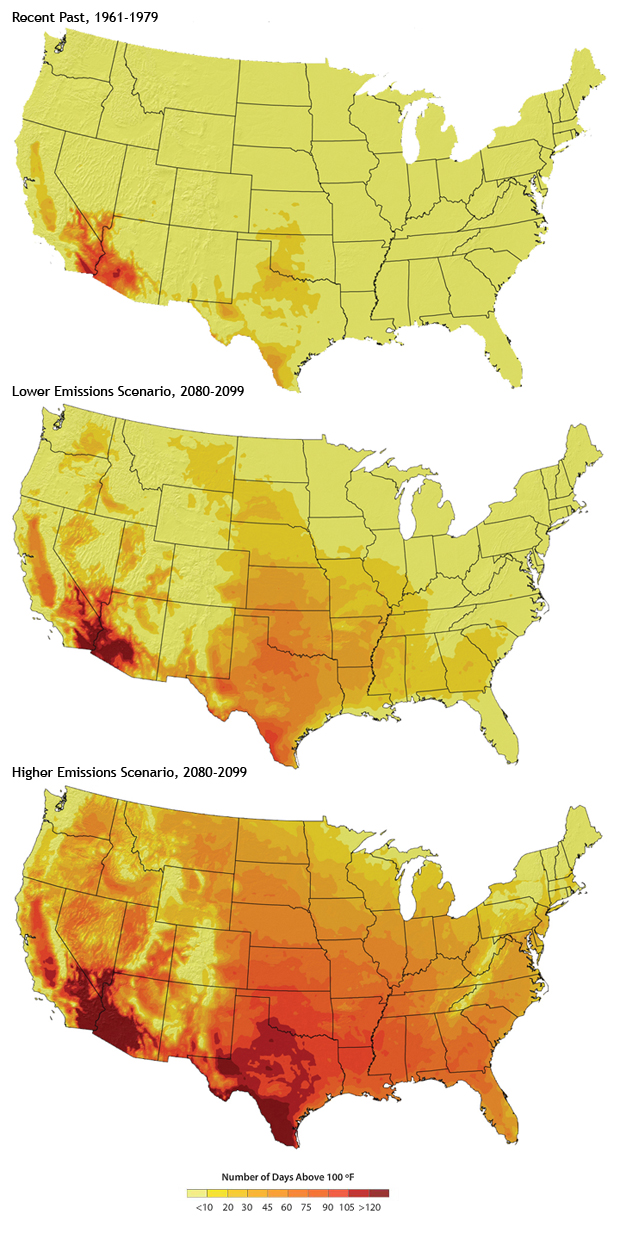
Image caption
The sequence of maps shows the average number of days on which the temperature across the United States exceeded 100°F between 1961 and 1979, and the number of 100-degree days that might be expected by the end of this century under two different scenarios of future greenhouse gas emissions, one with lower (but still increasing) emissions and one with higher.