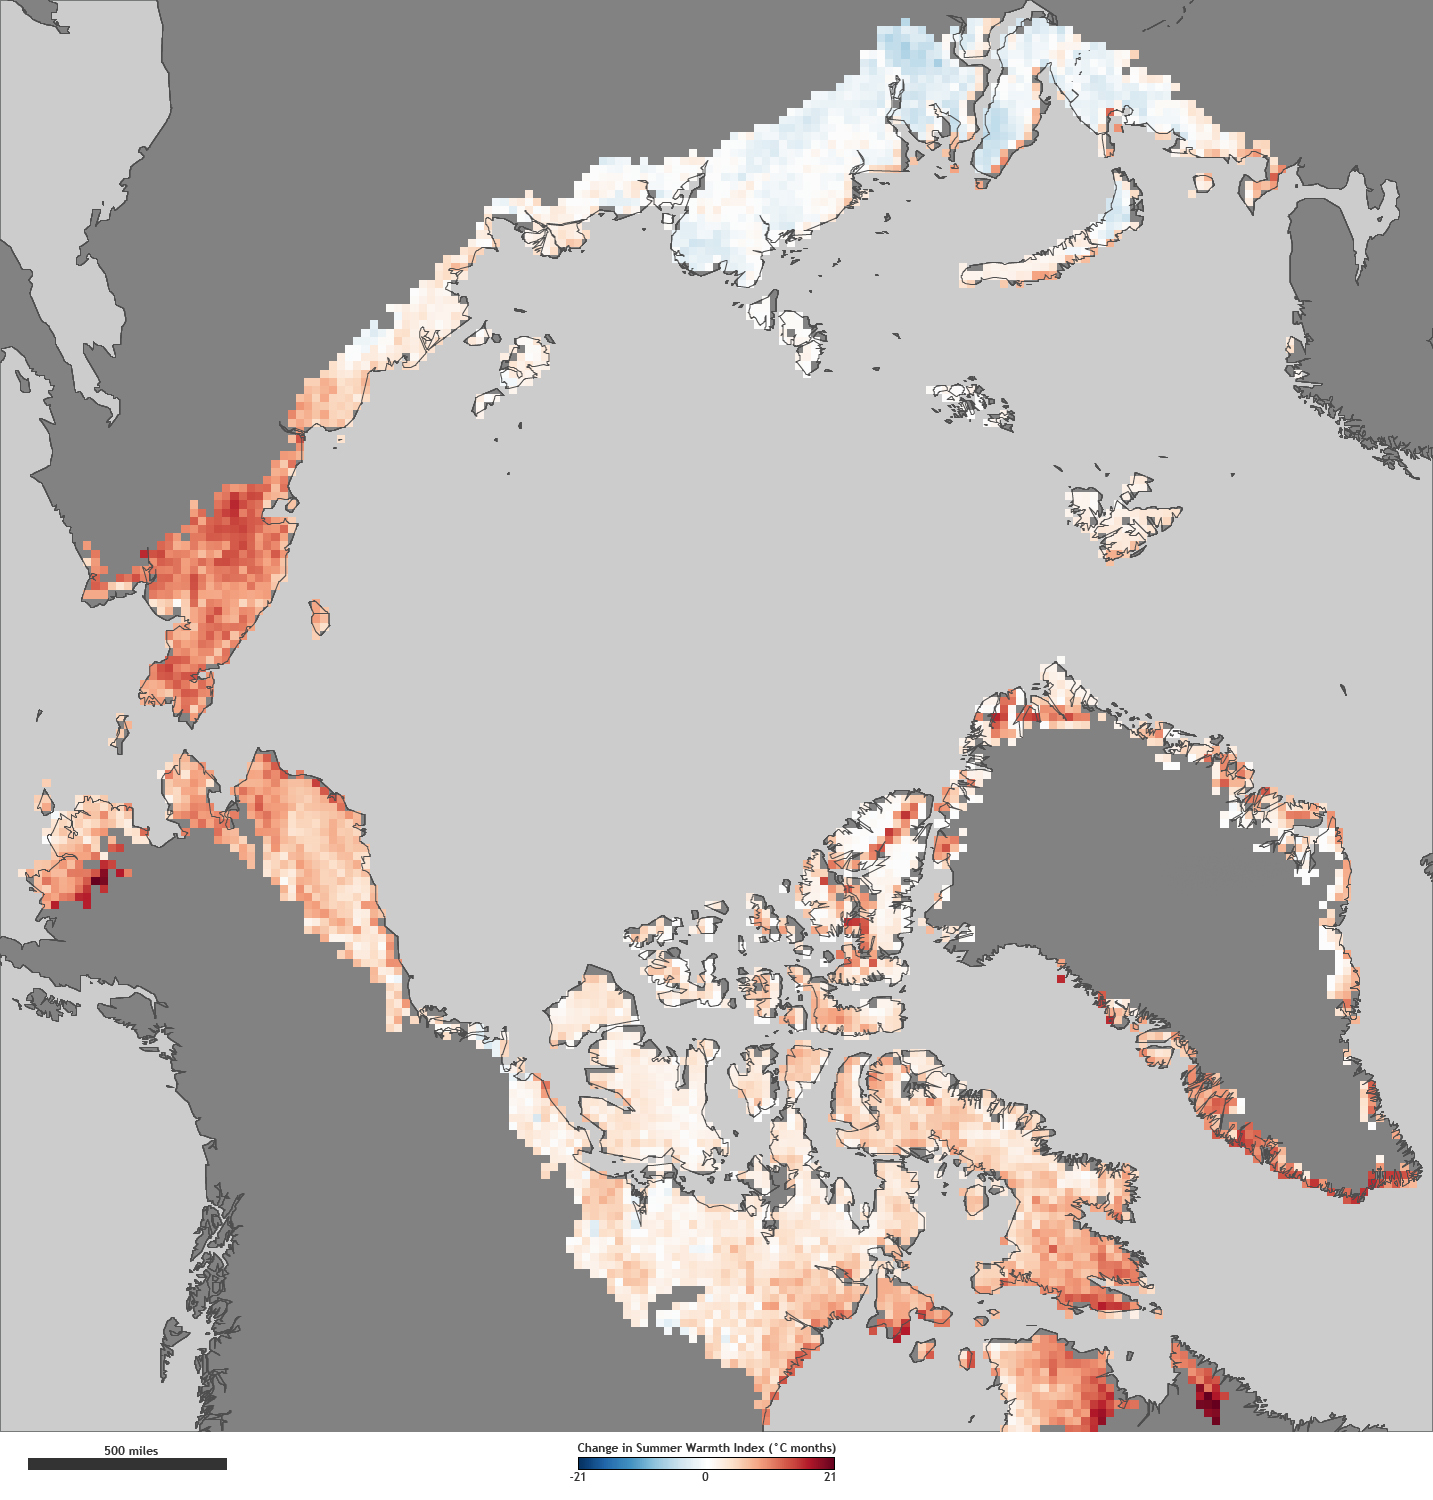
Image caption
Changes in the sum of monthly average temperatures above freezing between 1982 and 2010 are shown in red (increases) and blue (decreases).
Changes in the sum of monthly average temperatures above freezing between 1982 and 2010 are shown in red (increases) and blue (decreases).