
Image caption
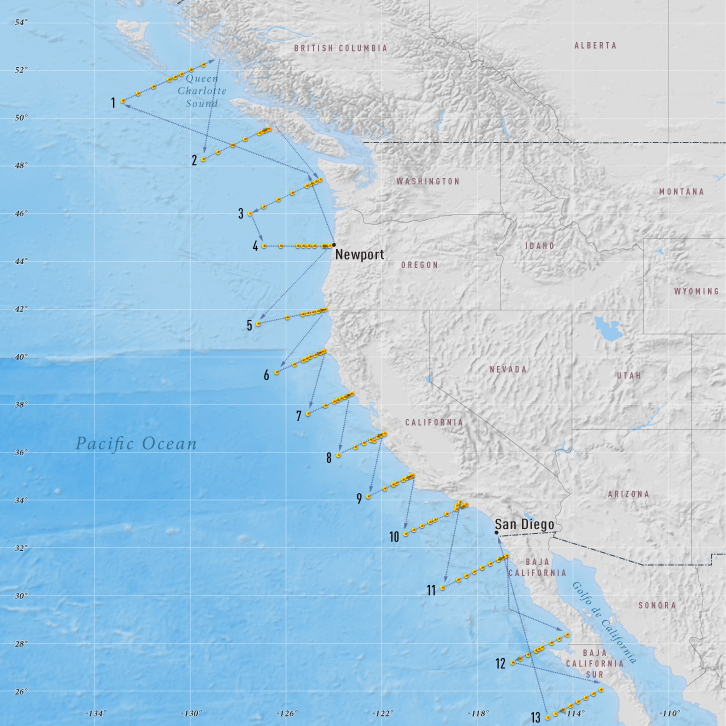
The map shows the path of the Research Vessel Wecoma during the NACP West Coast Survey Cruise. The yellow dots represent station locations, where the crew collected ocean water samples.
The map shows the path of the Research Vessel Wecoma during the NACP West Coast Survey Cruise. The yellow dots represent station locations, where the crew collected ocean water samples.