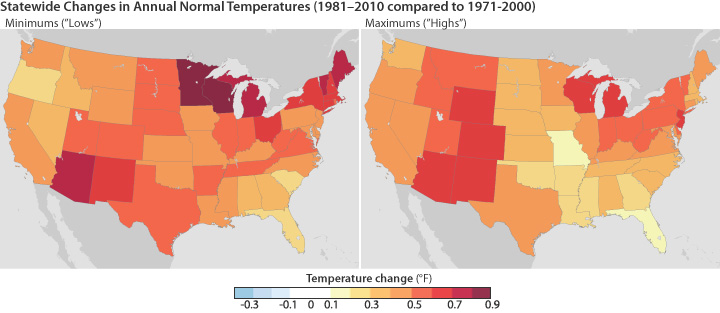
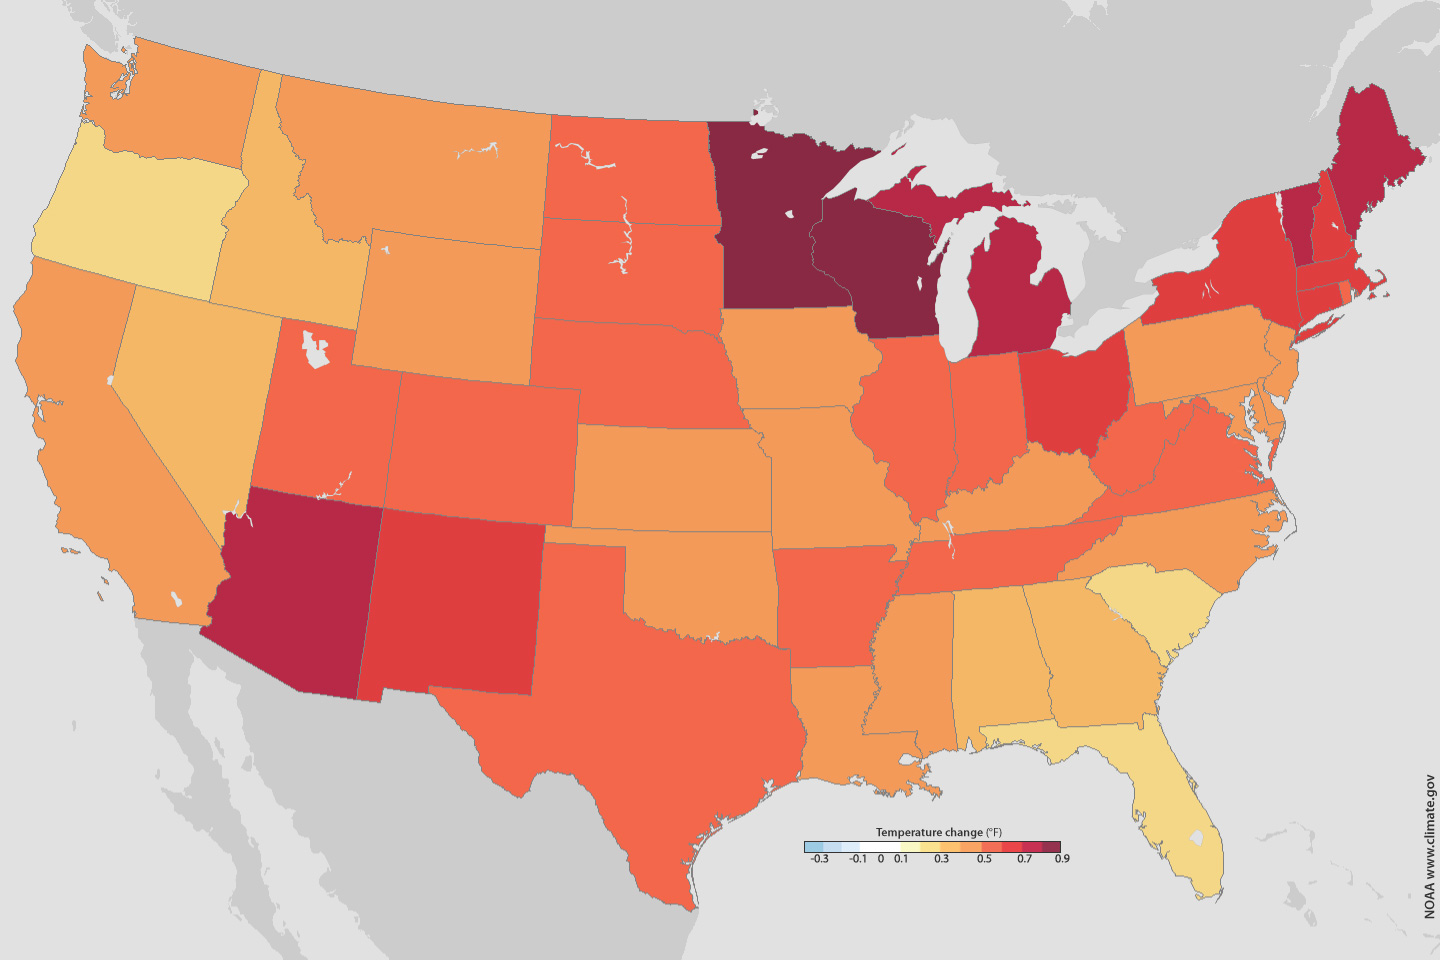
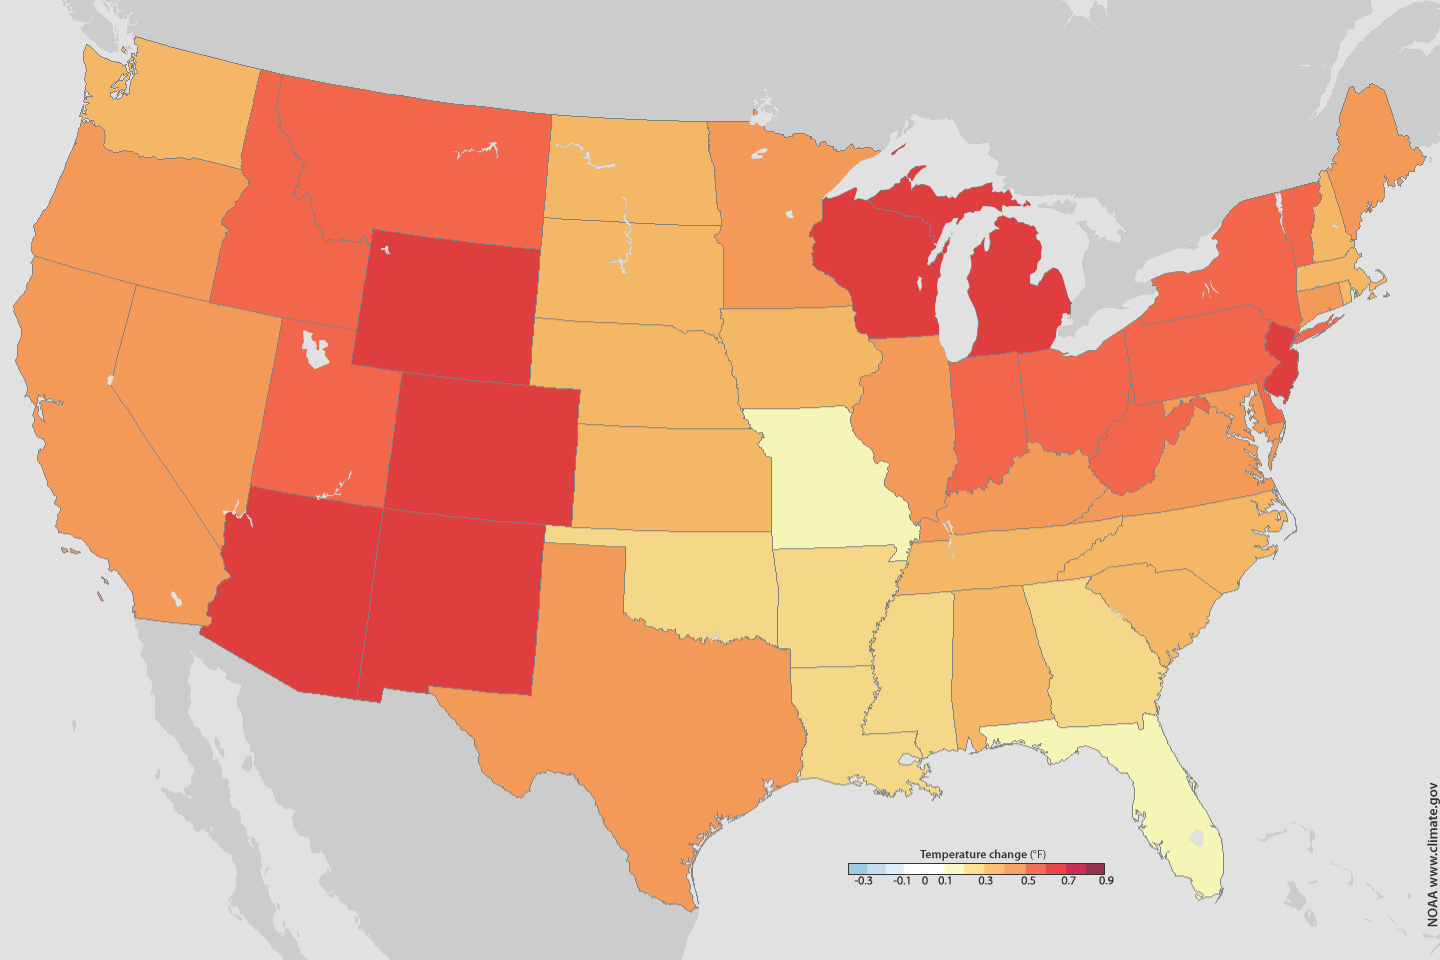
File name: state_annualmaxmin_720.jpg Original Resolution (pixels): 720 × 313 File Size: 70 KB (MIME Type: image/jpeg) Date Published: March 10, 2013 Alternate Text: Temperature change maps: minimums and maximums View image full size Download file Image caption On a state-by-state basis, the annual average minimum (left) and maximum (right) temperatures across the United States are warmer in the 1981-2010 Climate Normals than in the 1971-2000 version. large maps: minimums| maximums
