
Image caption
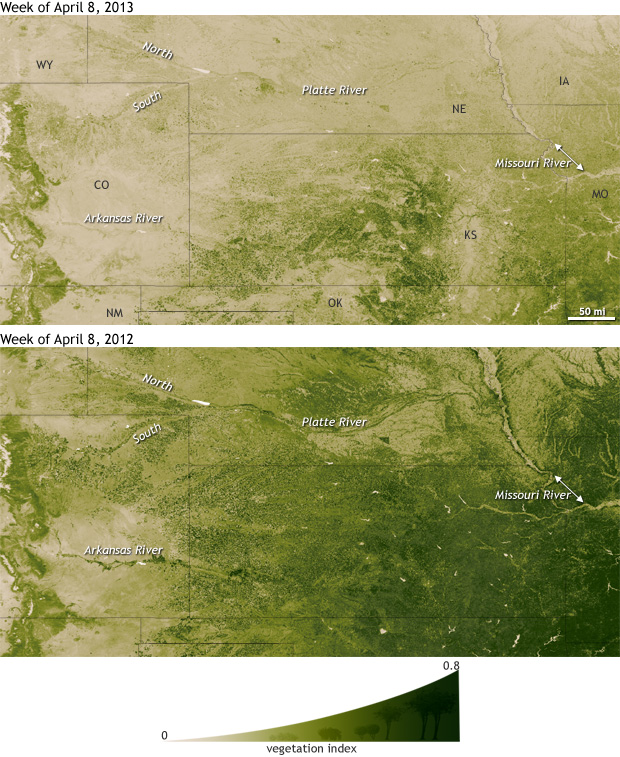
Maps of vegetation greenness in the week of April 8, 2013 (top) and 2012 (bottom). The impact of the severe to exceptional drought in the High Plains is obvious. Maps by Dan Pisut, based on data from the NASA/NOAA Suomi NPP satellite.
Maps of vegetation greenness in the week of April 8, 2013 (top) and 2012 (bottom). The impact of the severe to exceptional drought in the High Plains is obvious. Maps by Dan Pisut, based on data from the NASA/NOAA Suomi NPP satellite.