
Image caption
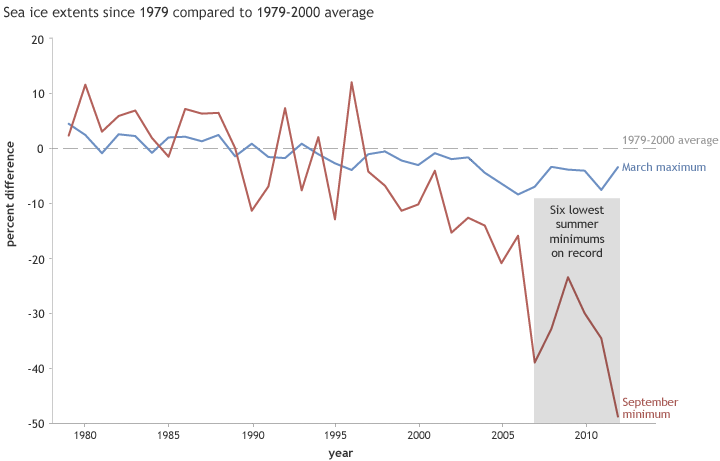
Percent difference in annual March maximum (red line) and September minimum (blue line) ice extent in the Arctic since 1979 compared to the 1979-2000 average (dashed line). Ice extent has decreased rapidly in the past decade. Graph adapted from Figure 5.20 in BAMS’ State of the Climate in 2012.