
Image caption
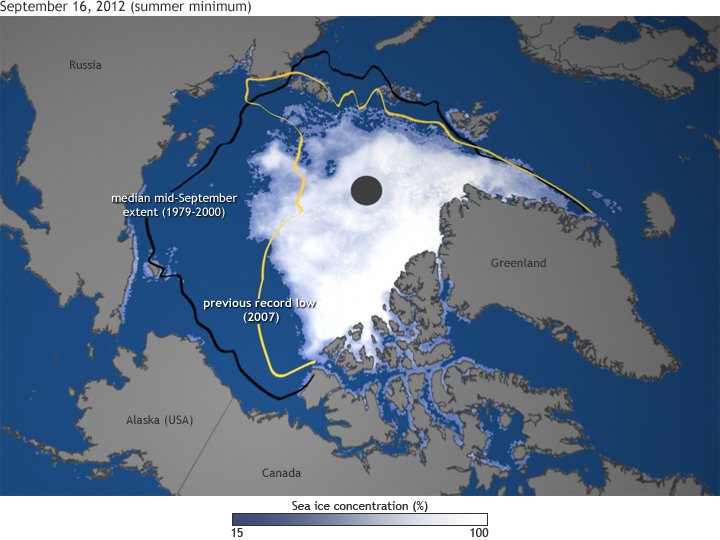
Map shows ice concentration on September 16, along with the extent of the previous record low (yellow line) and the mid-September median extent (black line).
Map shows ice concentration on September 16, along with the extent of the previous record low (yellow line) and the mid-September median extent (black line).