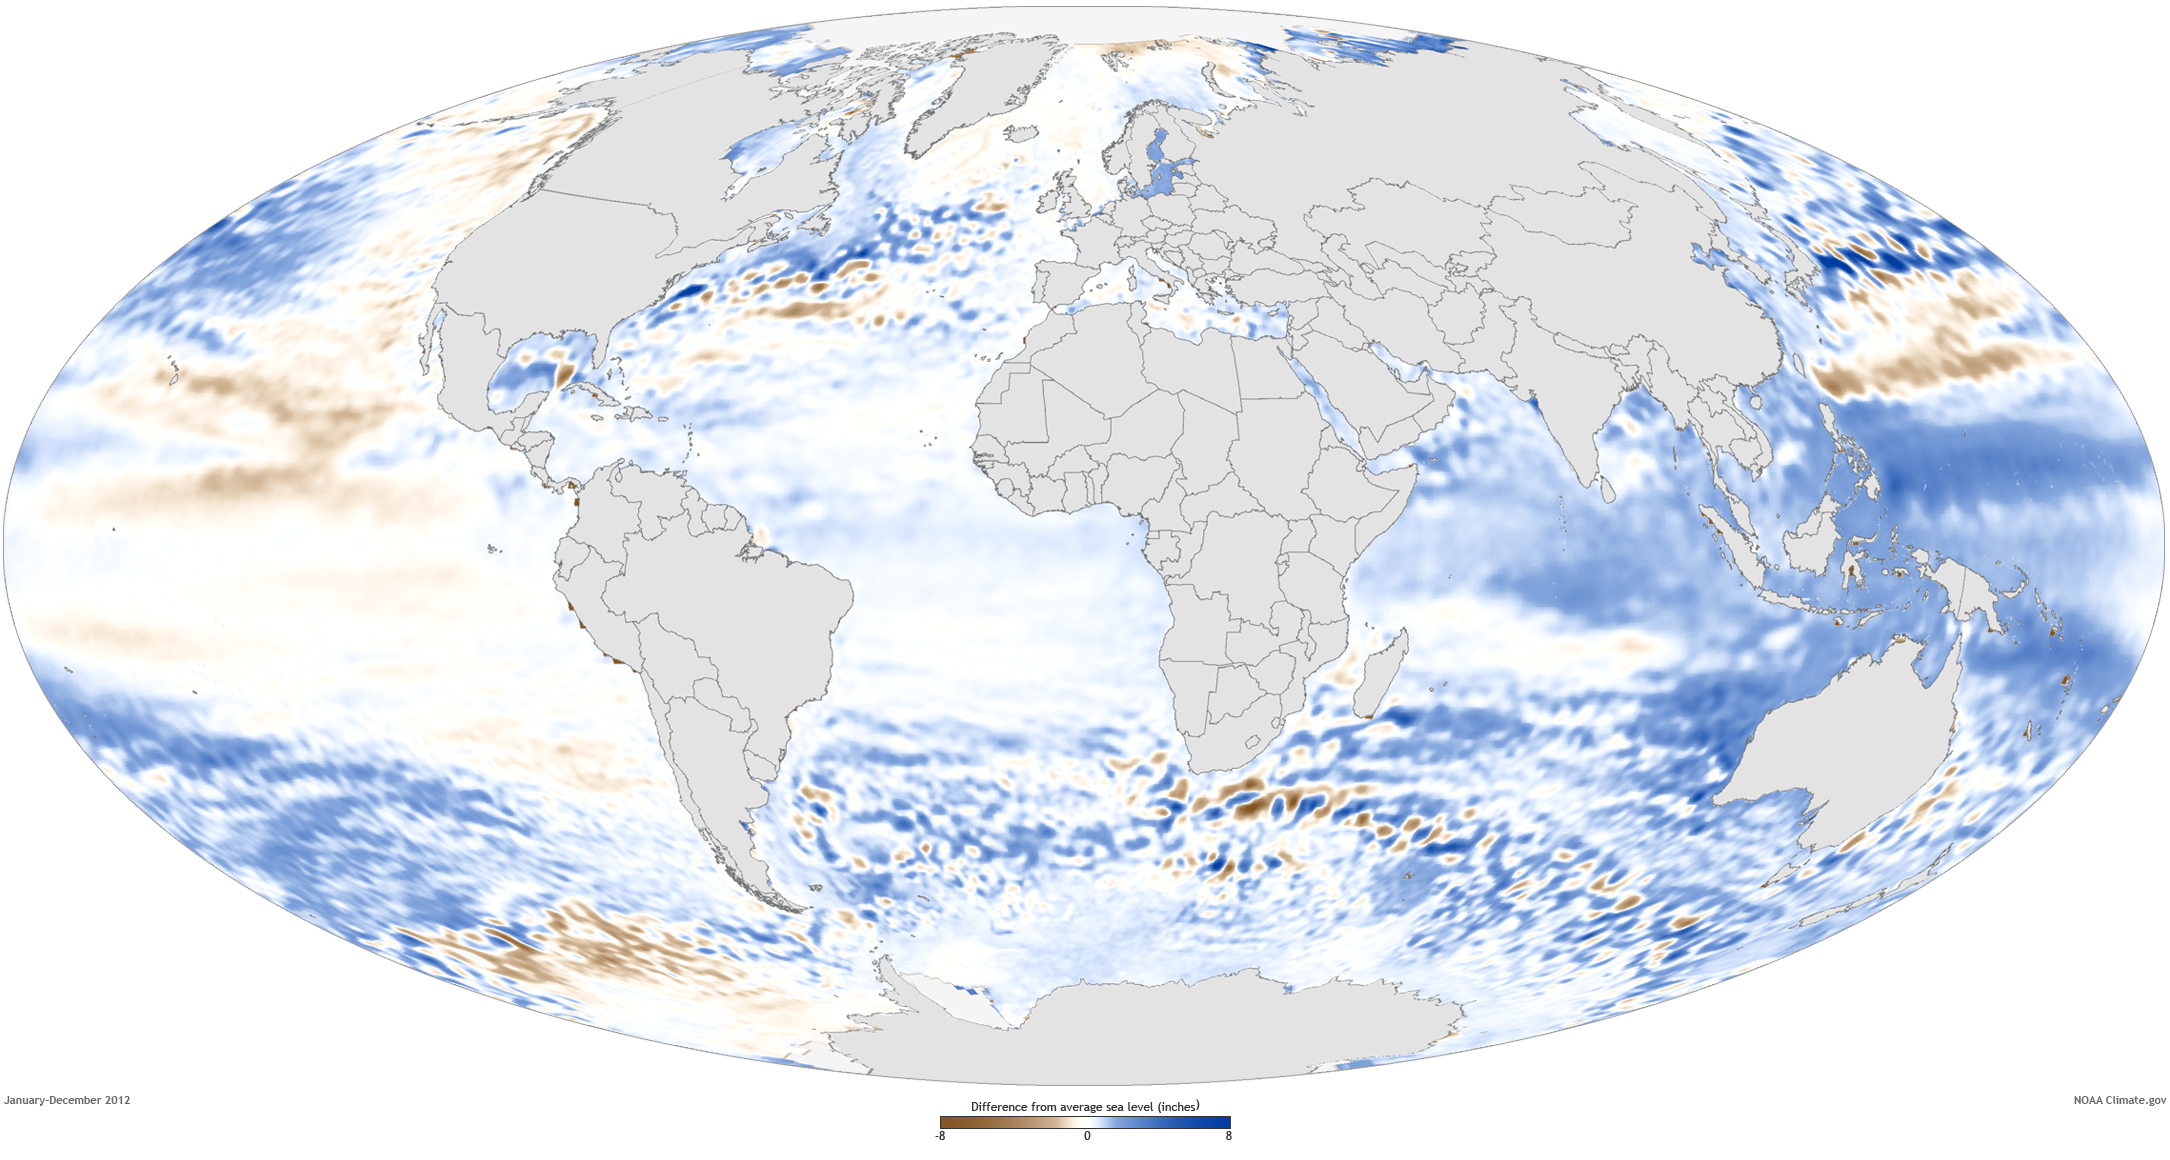
Image caption
Sea level in 2012 compared to the 1993-2012 average based on AVISO satellite data. Map adapted from Figure 3.27a in the 2012 BAMS State of the Climate Report.
Sea level in 2012 compared to the 1993-2012 average based on AVISO satellite data. Map adapted from Figure 3.27a in the 2012 BAMS State of the Climate Report.