
Image caption
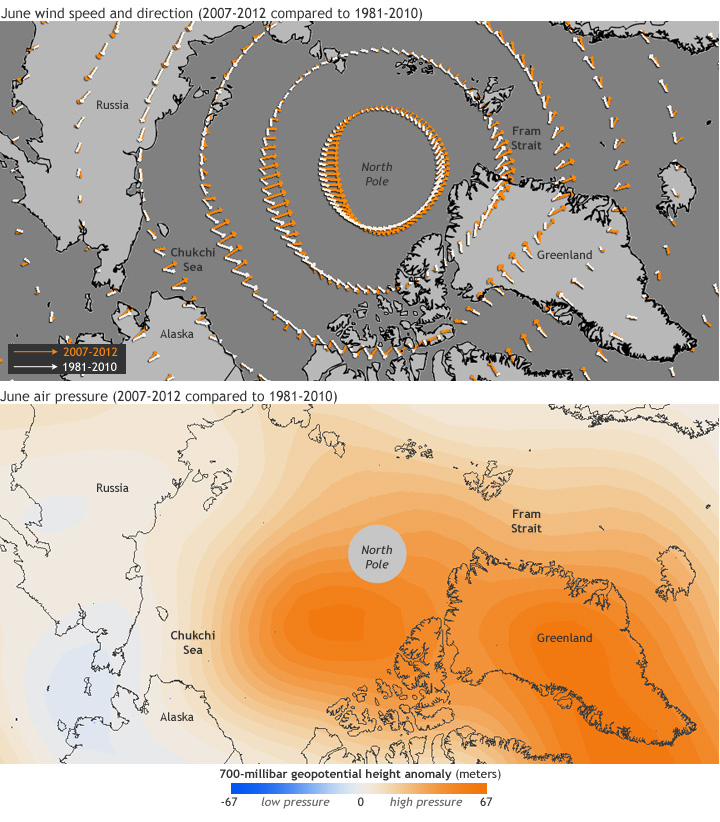
(top) Average June wind vectors in 2007-2012 (orange) compared to 1981-2010 average (white). (bottom) Average geopotential height anomaly at 700 millibar pressure level in Junes from 2007-2012 compared to the long-term average (1981-2010), based on NCEP reanalysis data provided by the Physical Sciences Division at NOAA ESRL. Orange colors are higher-than-average pressure; blue is lower-than-average pressure.