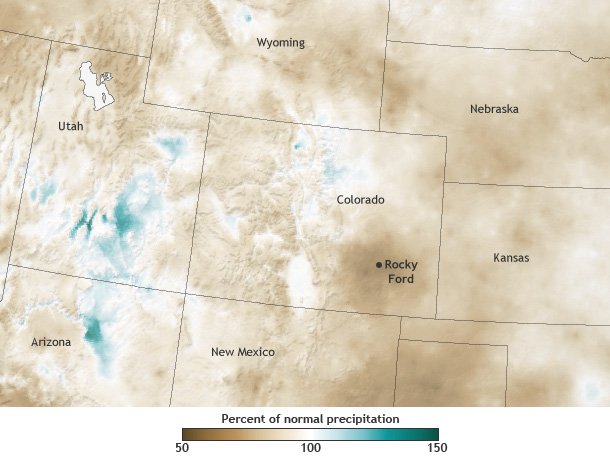
Image caption
Percent of normal precipitation for July 2011-December 2013 as compared to the 1981-2010 average. Map by NOAA Climate.gov, based on PRISM data. Data from most recent 6 months are provisional.
Percent of normal precipitation for July 2011-December 2013 as compared to the 1981-2010 average. Map by NOAA Climate.gov, based on PRISM data. Data from most recent 6 months are provisional.