Image caption
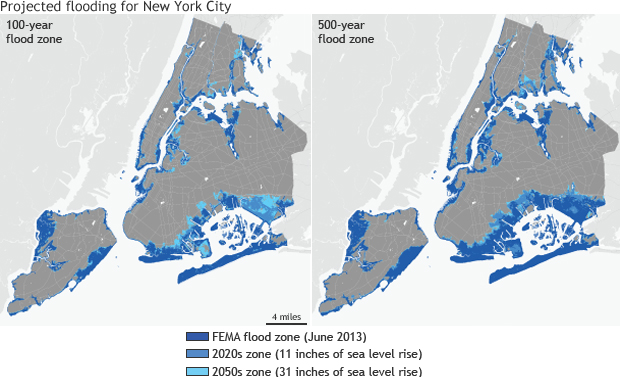
Areas projected to be inundated during a 100-year flood (left, large version) and a 500-year flood (right, large version). Each map shows how the current FEMA flood zone (dark blue) will grow by the 2020s (medium blue) and 2050s (light blue) under an extreme sea level rise projection of 31 inches by 2050. Areas in the 100-year flood zone have a 1 percent chance of being flooded annually. Areas in the 500-year flood zone have a 0.2 percent chance of being flooded annually. Maps by NOAA Climate.gov based on data courtesy FEMA (current) and the New York City Panel on Climate Change (projected).